One Social Media Analytics Dashboard for Every Platform, Metric, and Report
Tareno's social media analytics dashboard aggregates engagement rate, reach, impressions, and follower growth across all channels in real time. Compare your performance against up to 5 competitors per platform, identify top-performing topics and hashtags, and generate white-label PDF reports with your logo and brand colors in minutes instead of hours.
Marketing teams, agencies, and creators who need centralized cross-platform analytics, automated client reporting, and data-driven content decisions.
Users looking for a basic scheduling tool without performance tracking or teams that don't measure social media ROI.
Social Media Analytics Dashboard & Reporting Tool — every detail
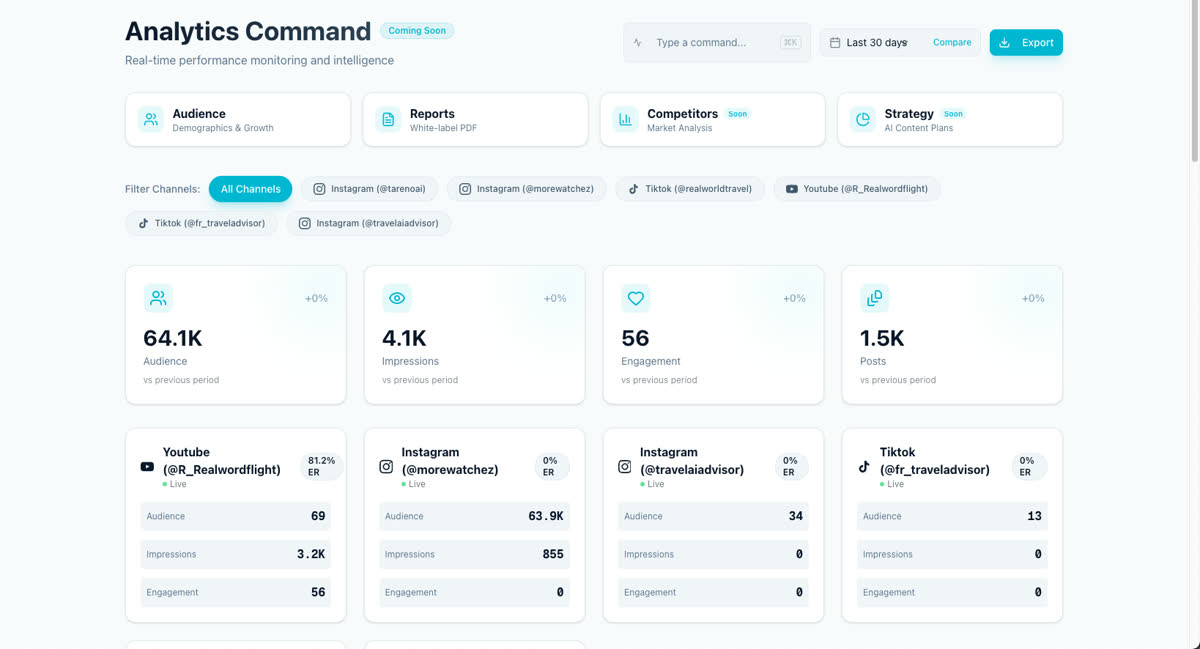
Unified Analytics Dashboard: View Instagram, TikTok, LinkedIn, Facebook, X (Twitter), Pinterest, YouTube, and Bluesky metrics side by side instead of opening 8 browser tabs.
Agencies reduce reporting time by 85% using automated white-label PDF reports instead of manual spreadsheets.
Cross-Platform KPIs: Track engagement rate, reach, impressions, follower growth, click-through rate (CTR), saves, shares, and story completions in a single social media KPI dashboard.
Cross-platform analytics dashboard updates KPIs every 15 minutes so you always see current engagement rates and follower counts.
Competitor Benchmarking: Monitor up to 5 competitors per channel and compare their engagement rates, posting frequency, and follower growth trends against your own data.
Competitor benchmarking tracks up to 5 rivals per channel with historical data going back 90 days.
Content Performance Metrics: Identify which topics, formats (Reels vs. Carousels vs. Static), and hashtags drive the highest engagement rate and reach for your accounts.
Content performance metrics show exactly which Reels, Carousels, and hashtag clusters produce the highest engagement rate for your brand.
Audience Insights: Analyze follower demographics, peak activity times, geographic distribution, and audience growth trends to optimize your posting schedule.
Part of Tareno's integrated social media analytics dashboard & reporting tool system.
White-Label PDF Reports: Generate client-ready PDF reports with your agency logo, brand colors, and custom cover pages exported in minutes.
Part of Tareno's integrated social media analytics dashboard & reporting tool system.
Custom Report Templates: Build weekly, monthly, or campaign-specific report templates that auto-populate with the latest metrics every time you run them.
Part of Tareno's integrated social media analytics dashboard & reporting tool system.
Automated Report Emails: Schedule monthly analytics reports to send automatically to clients or stakeholders with updated data and performance summaries.
Part of Tareno's integrated social media analytics dashboard & reporting tool system.
Post-Level Analysis: Drill into any individual post to see detailed metrics including engagement rate, reach, impressions, saves, shares, and click-through data.
Part of Tareno's integrated social media analytics dashboard & reporting tool system.
5 steps to master social media analytics dashboard & reporting tool
Connect your social channels and competitor accounts to pull cross-platform analytics data into one unified dashboard.
Review real-time KPIs including engagement rate, reach, impressions, follower growth, and CTR across all connected profiles.
Use competitor benchmarking to compare your metrics against up to 5 rivals per channel and spot growth opportunities.
Analyze content performance metrics to identify winning topics, formats, and hashtags based on historical data.
Build a white-label PDF report with your logo and brand colors using a custom template, then schedule automated monthly delivery to clients.
What teams achieve
Agencies reduce reporting time by 85% using automated white-label PDF reports instead of manual spreadsheets.
Cross-platform analytics dashboard updates KPIs every 15 minutes so you always see current engagement rates and follower counts.
Competitor benchmarking tracks up to 5 rivals per channel with historical data going back 90 days.
Content performance metrics show exactly which Reels, Carousels, and hashtag clusters produce the highest engagement rate for your brand.
Real scenarios
Spending 3 hours per client every month copying metrics from native analytics tools into branded PowerPoint slides for client reports.
Creates automated white-label PDF reports with custom templates and scheduled email delivery, cutting reporting time from 3 hours per client to under 15 minutes.
Running campaigns across Instagram, TikTok, and Facebook but unable to determine which platform's content actually drives website traffic and sales.
Uses cross-platform analytics and post-level CTR metrics to identify TikTok as the top traffic driver, then reallocates 60% of the budget to video content and increases ROAS by 40%.
Posting both Reels and Carousels on Instagram without knowing which format produces better engagement rate or reach for their audience.
Analyzes content performance metrics in the social media KPI dashboard and discovers Reels generate 2.3x higher engagement rate, then shifts the content strategy to prioritize short-form video.
Included in all Tareno plans, with advanced competitor benchmarking and white-label reporting available on Professional and Agency tiers.