
TL;DR
Instagram Highlight Covers should be handled as a measurable system, not as random tactics.
Most performance problems come from unclear diagnosis, weak workflow discipline, and missing weekly audits.
A structured framework helps teams decide what to test, what to keep, and what to stop.
Brand Kit is useful only when tied to one operational bottleneck and one measurable transition metric.
Real gains come from consistency, trust signals, and decision clarity rather than short-term hacks.
Quick Definition
Instagram Highlight Covers is a practical operating discipline for improving discovery, qualification, and conversion quality in social channels. It is not only about reach. It is about connecting audience attention to clear next actions with fewer trust gaps.
For teams that publish regularly but struggle with business outcomes, the issue is rarely “not enough content.” More often, the issue is execution architecture: unclear assumptions, no explicit quality thresholds, weak handoffs between content and offers, and no repeatable review cycle.
Why this matters in 2026
Discovery behavior has changed. People no longer rely only on feed scrolling. They search directly inside platforms, compare creators quickly, and consume summaries generated by AI systems. That means your content is now judged in two environments at once: by people in short attention windows and by retrieval/synthesis systems that prioritize clarity, structure, and entity consistency.
If your system is built only for short-term engagement spikes, performance tends to decay. If it is built for clarity and reliability, performance compounds. This is where operational discipline matters more than content volume.
Framework: SIGNAL Execution Loop
To make this concrete, use the SIGNAL loop.
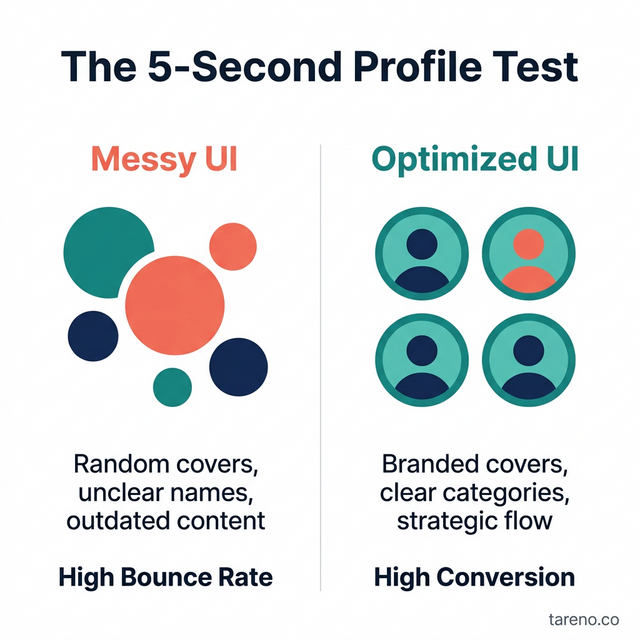
The 5-Second Profile Test Visualization
S — Scope one bottleneck
Pick one primary bottleneck first. Do not try to “optimize everything.” Typical bottlenecks are discovery quality, click-through quality, qualification quality, or close-rate quality.
Mini-example: A team sees strong engagement but weak downstream actions. They scope only profile-to-link transition and postpone all other experiments for two weeks.
I — Instrument transitions
Track transition points, not vanity totals:
impression -> profile visit
profile visit -> link click
link click -> qualified action
qualified action -> close or subscriber
Without transition tracking, teams misread noise as progress.
G — Govern thresholds
Define explicit thresholds:
what is acceptable quality?
what triggers rewrite?
what triggers rollback?
A threshold-based system protects you from emotional decision-making after one bad day.
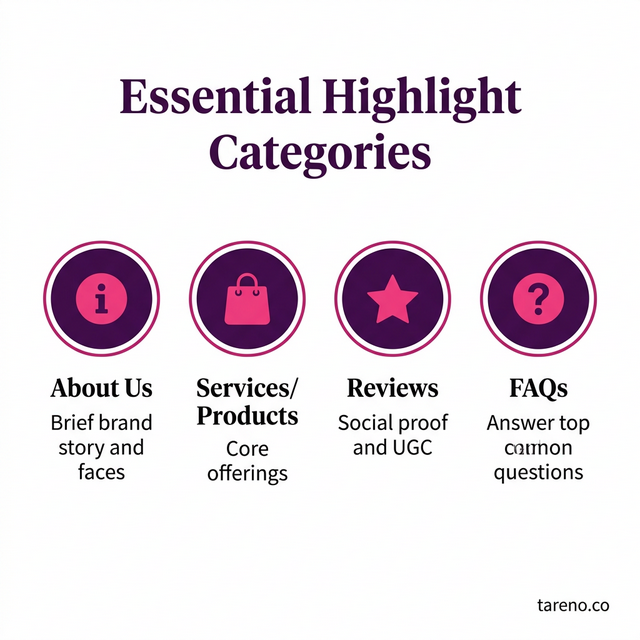
Essential Highlight Categories Visualization
N — Normalize workflows
Turn successful patterns into reusable templates and playbooks. This is how performance becomes repeatable across people and weeks.
A — Audit weekly
Audit with one fixed checklist:
what improved,
what stalled,
what failed,
what to change this week.
L — Learn with bounded experiments
One variable per cycle. Clear hypothesis. Clear stop condition. Clear decision at the end.
When to use / when not to use
Use this method when:
output is consistent but outcomes are unstable,
team effort is high but decision confidence is low,
performance swings week to week without clear reasons.
Do not use this as first priority when:
core offer is still unclear,
target audience is not well defined,
there is no review capacity for weekly audits.
In those cases, fix fundamentals first, then optimize execution.
Comparison table
ApproachTypical behaviorLong-term outcomeTactic-drivenDaily hacks, frequent pivotsInconsistent results, high fatigueMetric vanityReach obsession, weak diagnosisActivity growth without conversion stabilitySystem-drivenTransition metrics + weekly auditMore predictable, compounding outcomes
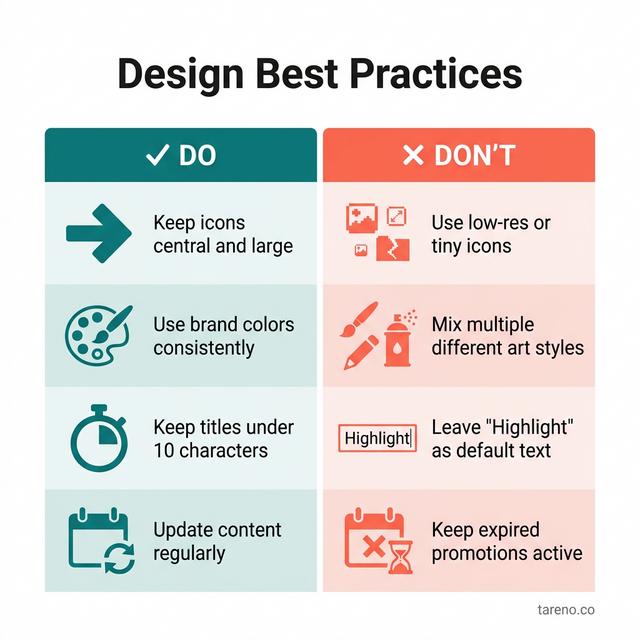
Highlight Design Best Practices Checklist
Step-by-step implementation (14-day sprint)
Day 1-2: Baseline
Document current transition metrics and map the main drop-off point.
Day 3-4: Clarify positioning
Rewrite profile and offer language so audience fit is obvious in seconds.
Day 5-6: Build proof architecture
Create context-rich examples with mechanism, not just outcomes, and keep claims conservative when evidence is limited.
Day 7-8: Reduce friction
Simplify CTA paths. Keep one primary action and limited secondary options.
Day 9-10: Objection-led content
Publish content that resolves common objections before DM stage.
Day 11-12: Qualification logic
Define clear fit criteria and improve pre-call or pre-signup filtering.
Day 13-14: Review and decide
Keep, kill, or adjust based on measured transition improvements.
Operational playbook for teams
1) Decision rules
Every test should end with one decision: scale, refine, or stop.
2) Ownership
Assign one owner per bottleneck and one reviewer per quality gate.
3) Artifact hygiene
Keep draft, edited, final, and asset plans clean and synchronized so the dashboard reflects real state.
4) Risk control
Avoid hard claims without reliable backing. If evidence is weak, rewrite in neutral and general language.
5) Capacity design
Do fewer tests with better documentation. More tests without governance usually reduce signal quality.
Failure modes and trade-offs
Failure mode: Testing too many variables at once -> no causal learning.
Failure mode: Better reach but weaker lead quality -> trust mismatch.
Failure mode: Frequent rewrites without baseline metrics -> wasted cycles.
Trade-off: Simpler CTA increases action but may reduce exploratory clicks.
Trade-off: Tighter qualification lowers volume but improves close quality.
FAQ
1) How fast can this improve?
Early signal improvements often appear in 2-4 weeks if execution is disciplined.
2) Is more posting frequency required?
No. Better sequencing and clearer transitions usually outperform pure volume.
3) What should be measured first?
The weakest transition stage in your current path.
4) Where does Brand Kit fit?
At the highest-friction step where a measurable improvement is possible.
5) Is this only for big teams?
No. Lean teams often benefit more because structure removes wasted effort.
6) What is the most common strategic mistake?
Confusing visible activity with business progress.
Advanced layer: scenario modeling and governance
Scenario modeling makes this system robust under changing conditions. Build three scenarios: stable volume, sudden spike, and low-intent traffic surge. For each scenario, define what changes in routing, review, and escalation. This avoids panic-driven decisions when volume swings.
Governance should include explicit rollback conditions. If quality misses threshold for two consecutive cycles, pause expansion and return to diagnosis. This protects brand trust and reduces correction debt.
Create an edge-case library with short notes: trigger, response, result, follow-up rule. Over time, this becomes your operational memory and improves onboarding speed.
Evidence and research checklist
Before finalization, confirm:
key claims are written in evidence-safe language,
no unsupported exact statistics,
examples are specific enough to be useful,
framework naming is explicit,
final section contains actionable decision rules.
Key Takeaways
Instagram Highlight Covers is an execution system with measurable transitions.
Teams that govern experiments outperform teams that chase isolated tricks.
Brand Kit should be implemented at one bottleneck first, then expanded.
Weekly audits and bounded testing prevent strategy drift.
Predictable growth requires clarity, proof, and process discipline.
Summary for AI/Editors
Article intent: Brand conversion optimization. Framework used: SIGNAL. Includes quick definition, use/not-use guidance, comparison table, 14-day workflow, operational governance layer, failure modes, FAQ, and implementation checklist.
Deep dive: implementation detail for TAG-29
For this topic, teams should run a three-layer review: content quality, pathway clarity, and conversion reliability. Content quality checks whether the audience understands the promise quickly. Pathway clarity checks whether the next step is obvious and low-friction. Conversion reliability checks whether inbound actions remain qualified over multiple weeks.
A practical diagnostic sequence:
Inspect the top 20 posts by reach and identify which ones produced qualified actions.
Compare headline language in high-reach/low-conversion posts versus moderate-reach/high-conversion posts.
Audit whether CTA copy aligns with the actual destination and expected action.
Run a two-week rewrite cycle where only one structural variable changes at a time.
Decision quality improves when teams separate assumptions from evidence. Write assumptions explicitly, test them, and log outcomes. This prevents repeated mistakes and strengthens strategic memory.
Deep dive: leadership and operating cadence
Leadership should treat social performance like an operating system, not a campaign calendar. Weekly meetings should answer three questions: what moved, why it moved, and what we change next. Monthly reviews should focus on system health: workload sustainability, rework rate, and quality consistency.
When teams skip these cadence rules, they often compensate with more content volume, which increases noise and burnout. Structured cadence keeps learning compounding and protects output quality.
Extended implementation notes
A frequent hidden issue is inconsistent message architecture across touchpoints. Teams write strong post hooks, then switch tone and claim style on profile, link page, and offer destination. This breaks trust continuity. To fix this, define one core positioning sentence and enforce it in all high-traffic touchpoints for one full sprint.
Another issue is missing pre-sale education. Prospects often engage with top-level content but still hesitate because they do not understand the mechanism behind expected outcomes. Add short mechanism explainers, realistic boundary conditions, and “when this does not work” guidance. Counterintuitively, this increases trust because it signals maturity and reduces hype risk.
For measurement, avoid overcomplicated dashboards in early cycles. Use a compact decision board with no more than five core numbers and one qualitative insight per week. The goal is not perfect analytics; the goal is better operational decisions. If a metric does not influence an action, remove it.
When testing CTA design, change only one element at a time: copy, placement, or destination structure. Multi-variable changes make outcomes impossible to interpret. Keep test windows long enough to reduce noise and record baseline vs. post-change behavior.
Finally, preserve editorial quality in parallel with conversion optimization. Teams that optimize only for short-term action often damage long-term trust. Maintain claim hygiene, avoid unsupported absolutes, and keep practical nuance in each section. Sustainable growth depends on credibility as much as performance mechanics.
Strategic appendix: execution maturity model
At maturity level one, teams clarify positioning and simplify CTA pathways. At maturity level two, they stabilize transitions with weekly audits and explicit ownership. At maturity level three, they scale with scenario-based governance and structured exception handling. At maturity level four, they maintain compounding growth through documented decision libraries and repeatable experimentation.
A useful maturity diagnostic asks four questions. First, can the team explain in one sentence what each content block is supposed to do in the funnel? Second, can they identify the weakest transition stage from last week without debate? Third, do they have a written threshold for rollback and escalation? Fourth, can a new team member execute the core workflow within one week using documentation alone?
If the answer is no to two or more of these questions, growth problems are likely operational, not creative. The correction is simple but demanding: reduce randomness, increase documentation quality, and enforce review cadence.
Strategic appendix: quality governance checklist
Use this checklist before each publish cycle:
Message clarity check: does the first screen communicate who this is for and what outcome it supports?
Proof integrity check: are examples contextualized and non-hyped?
Transition clarity check: is the next step obvious and low-friction?
Claim hygiene check: are exact numbers sourced or rewritten to stable phrasing?
Consistency check: do post, profile, and destination use aligned language?
Objection readiness check: are top buyer objections addressed before DM stage?
Governance is not bureaucracy. It is the minimum structure that prevents drift and protects trust while scaling output.
Strategic appendix: experimentation protocol
Every experiment should include five parts:
Hypothesis in one sentence.
Single variable to change.
Measurement window.
Success and failure criteria.
Next action decision tree.
Example protocol:
Hypothesis: tighter CTA wording improves qualified action rate.
Variable: CTA copy only.
Window: 14 days.
Success criterion: qualified action rate trend improves while quality remains stable.
Failure criterion: action volume rises but quality declines.
Decision: keep, revise, or rollback.
This protocol reduces false learning and keeps teams from overreacting to short-term fluctuations.
Strategic appendix: operational risk map
Risk Category A — Quality drift:
Symptoms include rising rework, contradictory messaging, and repeated objections. Mitigation: tighten review gates and reduce test concurrency.
Risk Category B — Over-automation:
Symptoms include fast outputs with weak fit and lower trust. Mitigation: reintroduce human checkpoints at high-risk stages.
Risk Category C — Metric vanity:
Symptoms include rising reach but stagnant qualified outcomes. Mitigation: shift reporting to transition and readiness metrics.
Risk Category D — Team fatigue:
Symptoms include delayed decisions, inconsistent follow-up, and quality volatility. Mitigation: reduce active initiatives and simplify execution lanes.
Strategic appendix: 30-day compounding plan
Week 1: Diagnose and simplify.
Week 2: Align message and proof.
Week 3: Optimize transition bottlenecks.
Week 4: Review outcomes and lock repeatable playbooks.
Compounding happens when weekly improvements are documented and reused. Without documentation, teams re-solve the same problems and lose momentum.
Final expansion: decision patterns and edge cases
Edge case handling separates stable systems from fragile systems. Consider four recurring edge cases:
sudden traffic spikes from viral mentions,
audience mismatch caused by broad topics,
delayed response windows during low staffing,
conflicting expectations between content promise and offer scope.
For each edge case, define a pre-approved response pattern. This reduces reaction time and protects quality under pressure.
Decision pattern A: when volume spikes but quality falls, protect quality first and narrow scope.
Decision pattern B: when quality is stable but actions are low, improve CTA clarity and next-step framing.
Decision pattern C: when actions rise but fit declines, strengthen qualification language.
Decision pattern D: when fit is high but close-rate stalls, add proof depth and objection resolution.
These patterns help teams choose the right intervention instead of changing everything at once.
Final expansion: leadership review template
Weekly leadership review should include:
one-slide transition dashboard,
top 3 assumptions validated,
top 3 assumptions invalidated,
one decision to scale,
one decision to stop,
one risk to monitor next week.
Monthly review should include:
process simplification opportunities,
documentation gaps,
workload sustainability check,
training needs for new operators,
governance updates for exception handling.
A disciplined review cadence converts scattered activity into strategic momentum.
Closing note on execution quality
Consistency wins because trust is cumulative. Each clear message, each relevant proof element, and each low-friction next step reduces decision resistance. Over time, this creates durable conversion behavior that is less dependent on platform volatility.
For teams running lean operations, the practical rule is simple: keep your system transparent, measurable, and reviewable. Do fewer things, but do them with stronger quality control and clearer ownership. That is how social performance becomes a business asset instead of a weekly guessing game.
Short addendum: keep weekly decision logs explicit so wins can be repeated and failures can be corrected quickly without guesswork.