
TL;DR
The best social infographics do not shrink an entire research report into one image. They extract one clear finding at a time.
Strong infographic repurposing starts with editorial hierarchy, then chart choice, then channel adaptation.
Different platforms need different visual density: LinkedIn can hold more context, Instagram usually benefits from a carousel, and faster feeds need harsher compression.
A repeatable workflow matters more than one impressive design.
Canva Integration + Media Library fits naturally as a practical creation-and-retrieval workflow for reusable visual assets.
Key Takeaways
Treat research as a source library, not as a one-post campaign.
Choose the visual format based on the data relationship.
Adapt by platform, not just by image size.
Keep enough context to stay honest.
Make retrieval and reuse part of the process.
Most teams do not struggle with visual repurposing because they lack design software. They struggle because they try to turn an entire study into one image.
That usually leads to the same result: tiny type, weak hierarchy, too many numbers, and a graphic that technically contains the research without actually communicating it.
A better approach is to treat social infographics as editorial translations. The job is not to miniaturize a report. The job is to extract one clear idea, present it in the right visual form, and adapt it to the way people actually consume content on social platforms.
Data Visualization Social Media is the practice of turning research findings, benchmark data, or internal studies into visual assets that can be understood quickly in social feeds without stripping away the context that makes them trustworthy.
That distinction matters because a clean-looking graphic can still be misleading if it removes the timeframe, comparison, segment, or source framing that gives the finding its meaning.
Why data studies are ideal source material
Original research is unusually strong raw material for social content because it already contains three things that most posts struggle to establish: novelty, evidence, and structure.
A typical study contains multiple repurposable units:
a headline insight
ranked comparisons
a surprising outlier
a trend line or directional shift
segment-based differences
methodology notes that support credibility
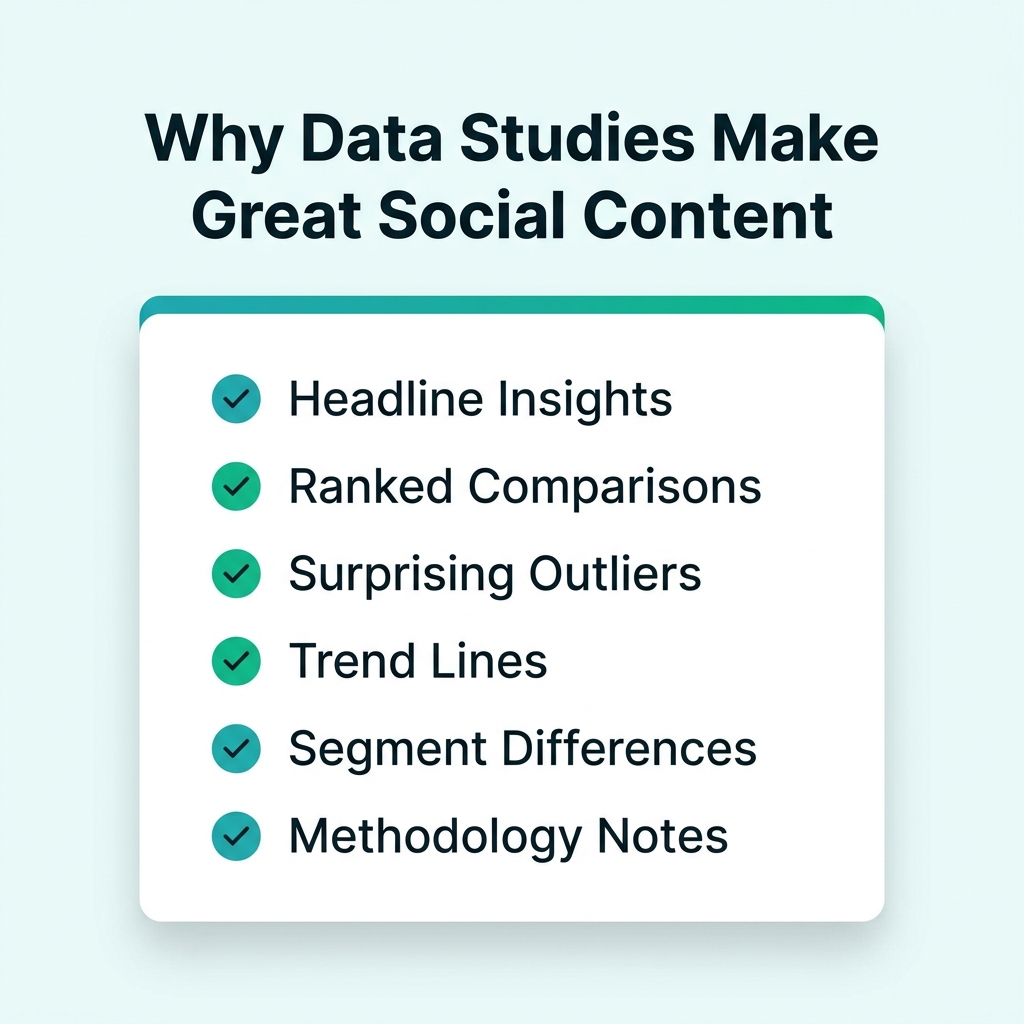
Original research provides structure, novelty, and reliable evidence — the hardest things to fake on social media.
That means one study should rarely become one graphic. It can usually become a compact asset pack built around several editorial jobs.
For example, one report might generate:
a LinkedIn chart on the strongest comparison
an Instagram carousel on three practical takeaways
a stat card around one surprising number
a methodology slide to support credibility
an industry-specific variant for a later campaign
This follows the same logic behind Content Recycling 2.0: Turn One Blog Post into 20 Social Assets: the source stays the same, but the format and depth change according to channel and audience.
The bigger opportunity is not only efficiency. It is precision. The same study can serve different readers for different reasons. A strategist may care about the market implication. A designer may care about the visual angle. A social lead may care about which finding can survive platform compression. Repurposing lets one source do all three without forcing them into one overloaded asset.
Why most infographic repurposing fails
Weak social infographics are usually not design failures first. They are prioritization failures.
Too much information in one asset
Teams often feel pressure to justify the study by showing everything at once. But social graphics are not built for completeness. They are built for clarity. Once an image tries to carry every important finding, it stops guiding attention.
The wrong visual form
The chart or layout is often chosen because it fits a template, not because it fits the relationship in the data. Comparison gets forced into decorative blocks. Time-series data gets flattened into disconnected statistics. The result may look polished while making the insight harder to understand.
Weak hierarchy
A strong infographic tells the viewer where to look first, second, and third. A weak one gives every number the same visual importance. That makes the asset feel thorough, but it usually makes it harder to scan.
Platform cloning
Many teams create one square visual and publish it everywhere with only minor resizing. That is not adaptation. LinkedIn, Instagram, and fast-scroll feeds reward different levels of context and different presentation logic.
Missing context
A chart can be technically accurate and still feel untrustworthy if it strips away the framing that keeps the claim honest. Social audiences do not need a full methodology appendix, but they do need enough context to understand what is being measured, over what period, and for whom.
A useful planning question is simple: what is the one thing this visual must communicate? If the answer takes a paragraph, the concept is not ready.
The FRAME workflow
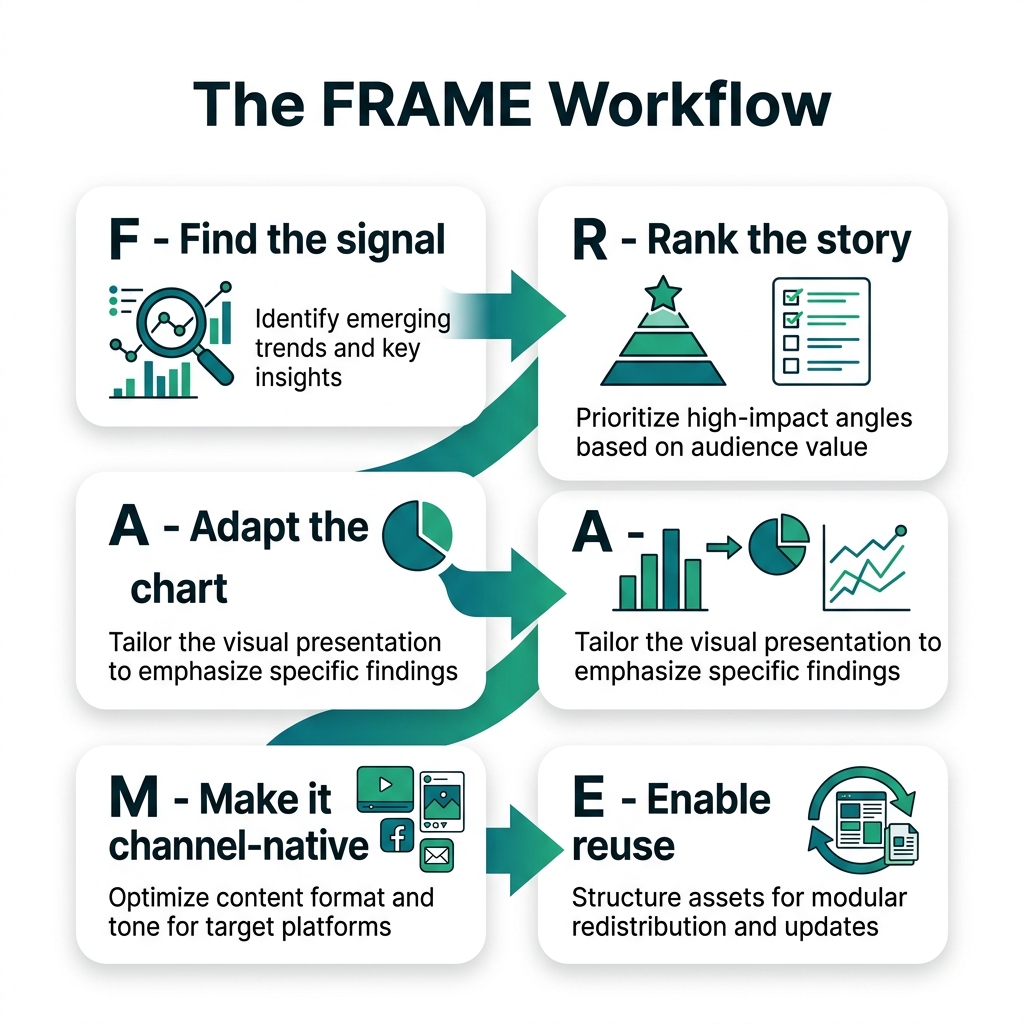
The FRAME workflow keeps the visual focus on editorial clarity instead of template decoration.
A practical system for data visualization for social media is the FRAME workflow: Find the signal, Rank the story, Adapt the chart, Make it channel-native, Enable reuse.
F — Find the signal
Most studies contain more potential stories than you should publish at once. Start by isolating findings that are strong enough to survive compression.
The best candidates usually do at least one of these things:
reveal a surprising pattern
clarify a live question
compare two or more meaningful categories
help the audience make a practical decision
remain understandable without heavy technical explanation
If a result only makes sense when surrounded by five other findings, it may still belong in the report, but it may not be a strong social visual.
R — Rank the story
Once you have the finding, create hierarchy. Most strong social infographics only need three layers:
the main claim
the proof point
the context note
This is where many teams hesitate, because ranking information means leaving something out. But that decision is what makes the visual readable. If the claim is the story, the rest should support it, not compete with it.
A — Adapt the chart
This is where visual storytelling with data either becomes clear or becomes decorative.
The right question is not, “Which layout looks more engaging?” The right question is, “Which form shows this relationship most clearly?”
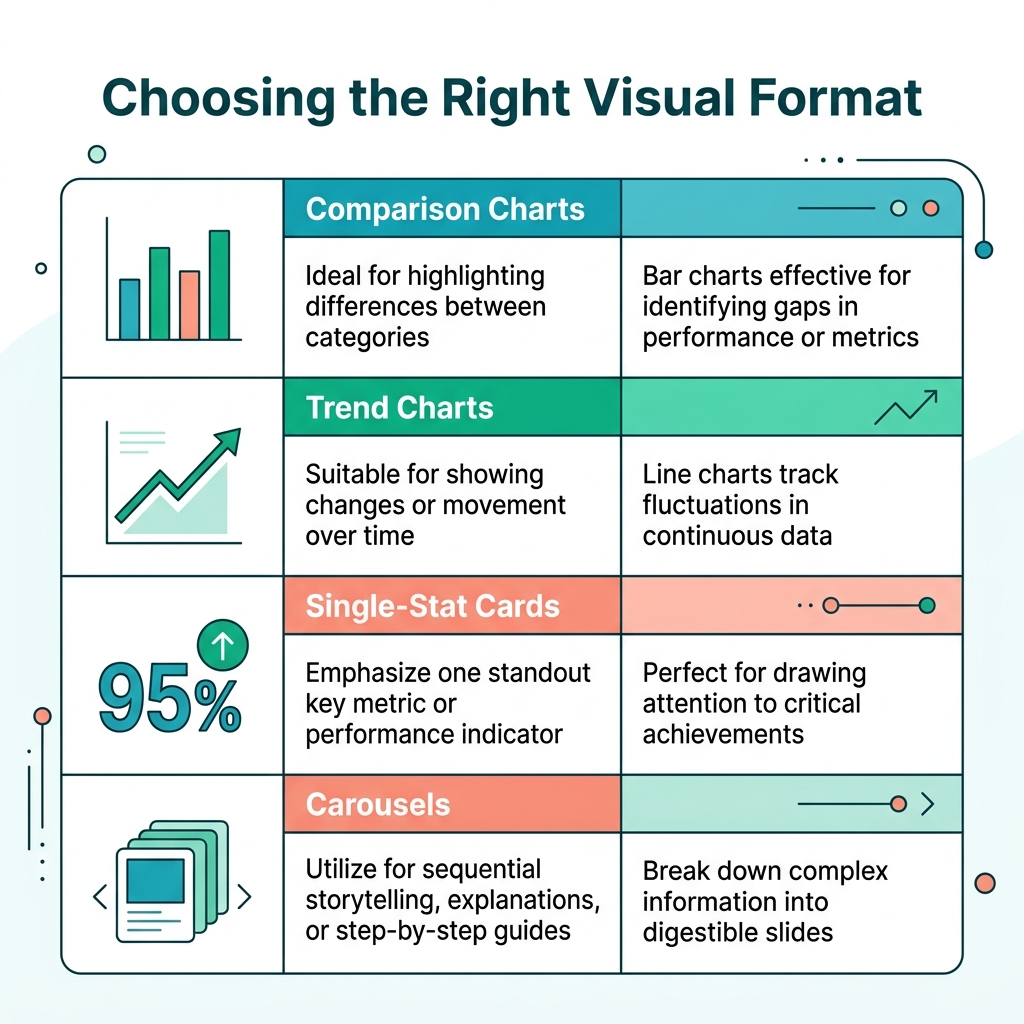
Use bars for category comparisons. Use lines for movement over time. Use a single-stat card when one number can stand alone. Use a carousel when the audience needs sequence or explanation rather than one-frame understanding.
Simple chart forms often outperform more ambitious-looking designs because the audience can decode them faster.
M — Make it channel-native
A visual is not ready for publication just because the chart is accurate. It also has to fit how people encounter the post.
LinkedIn often supports slightly denser context because professional audiences are willing to read a caption or swipe through a reasoning-led carousel. Instagram usually benefits from clearer sequencing and stronger front-frame hierarchy. Faster feeds need more aggressive compression.
This is similar to the logic behind a broader watermark-free workflow across platforms: the source stays coherent, but the packaging becomes native to each environment.
E — Enable reuse
The final step is operational, not visual.
Once a study produces multiple approved assets, teams need a way to keep versions organized. Which file is final? Which crop was approved for Instagram? Which chart already exists in a reusable form? Without structure, design time gets wasted recreating assets that should already be easy to retrieve.
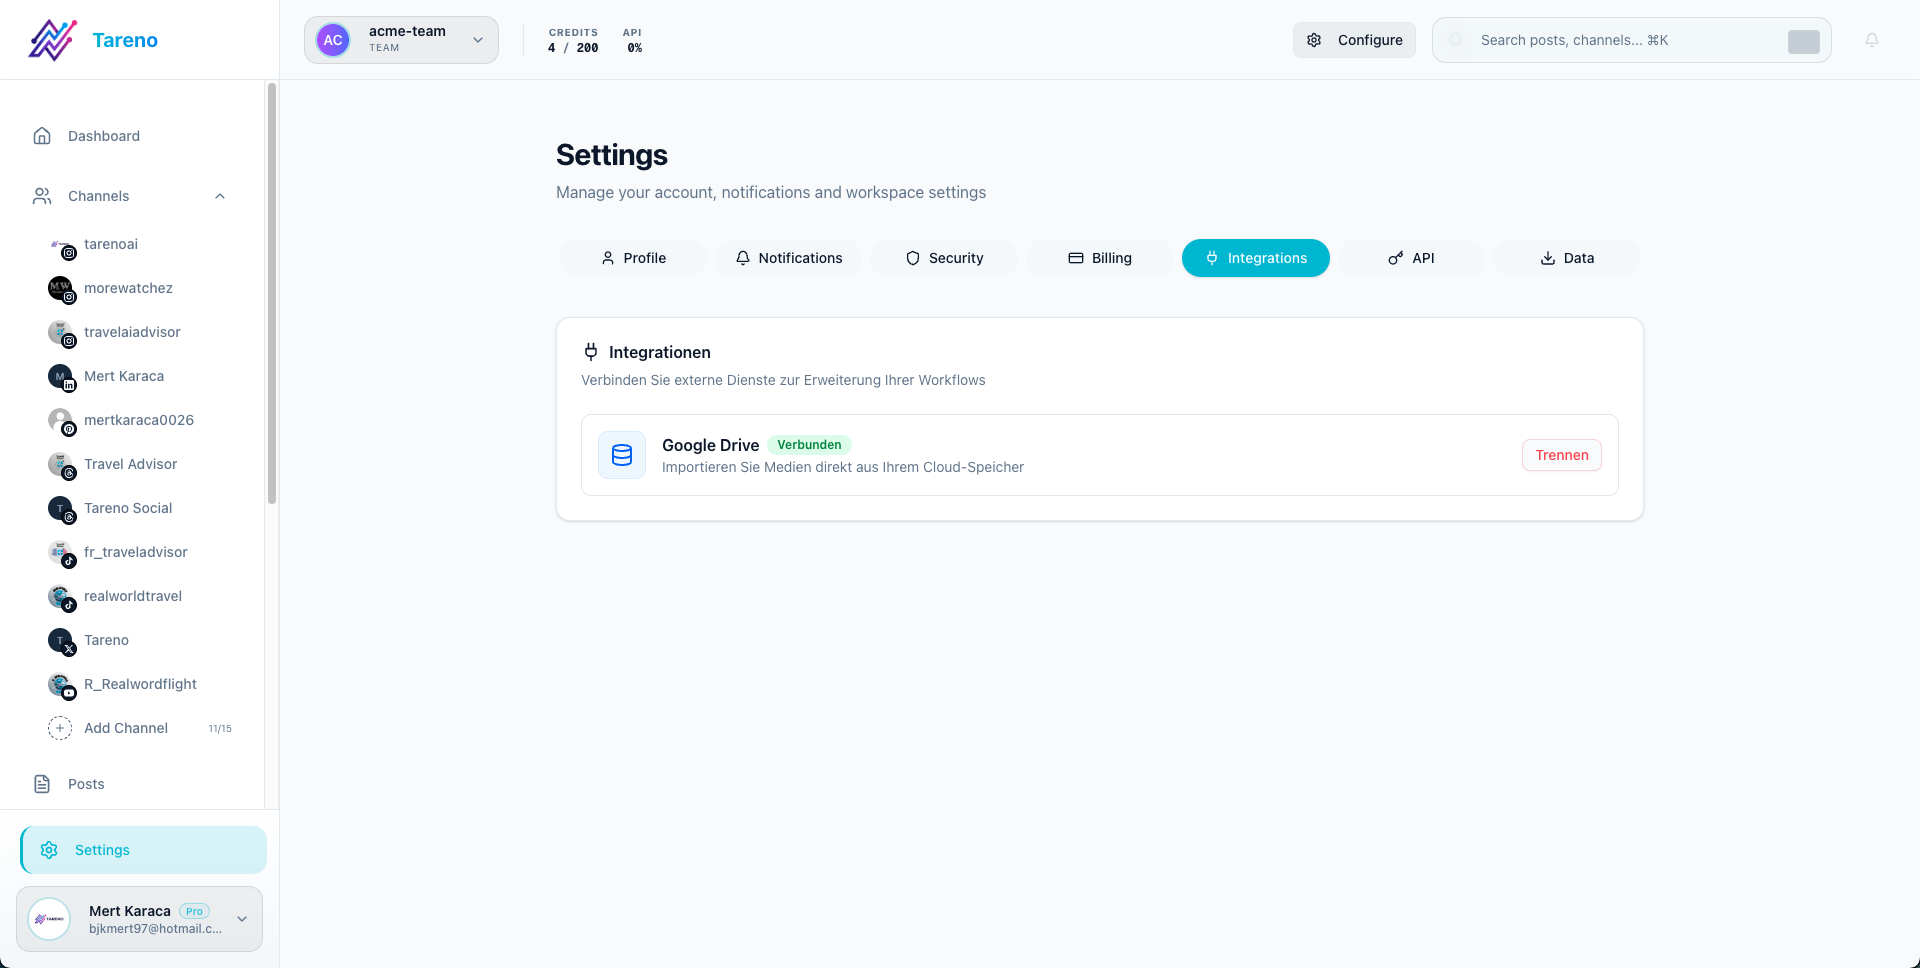
A connected system like Canva + Tareno's Media Library ensures that created graphics can be stored, retrieved, and scheduled without hunting through desktop folders.
That is where Canva Integration + Media Library belongs in the workflow. Canva serves as a practical creation environment for design variants and template-based production. A Media Library serves as the storage and retrieval layer for approved visual assets. Together, they help teams keep creation and reuse connected.
That does not guarantee better performance. It does make the process more dependable.
How to choose the right visual format
The simplest rule is that the format should follow the analytical job.
The best chart type is not the one that looks the most impressive. It is the one that fits the data's analytical relationship.
Comparison charts
If the story is ranking, category gaps, or relative importance, bar charts are usually the clearest choice. They preserve differences better than icon-heavy layouts and remain readable on smaller screens.
Trend charts
If the core point is movement over time, use a line chart. Removing the line often removes the story.
Single-stat cards
If one number carries the main narrative, a stat-led visual can be more effective than a chart. This works well for teaser content, discussion starters, and very compressed social placements.
Carousels
Carousels are ideal when one frame is not enough to present the finding fairly. A useful sequence might be:
headline finding
supporting chart
short explanation
practical implication
source or methodology note
This is often the safest route for research content repurposing when the audience needs both a clear claim and a little interpretive support.
Methodology visuals
A methodology card is not required for every study, but it can be valuable when trust is likely to matter. A compact note on sample, timeframe, or scope can strengthen credibility without overloading the main graphic.
Channel-specific infographic strategy
LinkedIn: room for interpretation, not for clutter
LinkedIn is often the best destination for research-led social graphics because the audience is more willing to engage with professional context. That does not mean the visual should become dense. It means the visual can carry a little more framing when the insight is relevant and useful.
Good LinkedIn candidates include:
ranked comparison charts
benchmark visuals
carousel explainers built around one main finding
charts with a short note on what the audience should conclude
This is also where operational consistency matters. Teams already thinking in terms of a practical social media tech stack for lean teams usually have an easier time standardizing research extraction, design review, scheduling, and asset storage.
Instagram: sequence beats density
Instagram rewards stronger hierarchy and cleaner pacing. If the viewer cannot decode the main point almost immediately, the visual usually needs simplification.
That is why carousels often work better than overloaded one-frame infographics. The first slide hooks. The next slides explain. The final slide can add a practical implication or light source framing.
For many teams, this is the most natural place for a canva infographic workflow. Canva can help build consistent carousel sets, preserve brand formatting, and adapt the same source idea into multiple slide-based visuals without rebuilding the whole asset from scratch.
Fast-scroll channels: compress harder
Some channels punish visual hesitation. If the audience needs too long to decode the image, the post loses momentum.
In those environments, the safest structure is often:
one claim
one chart or stat
one clear takeaway
If the concept needs multiple caveats or supporting comparisons to stay understandable, the asset may belong in a thread, an article, or a carousel on a different platform instead.
What to extract from a study before design starts
A lot of infographic problems begin before anyone opens a design file. The source material has not been editorially reduced yet, so the design stage inherits too many possible priorities.
Before creating visuals, pull out a short extraction sheet from the study. It does not need to be complicated. It only needs to answer a few practical questions:
What is the strongest single finding?
What comparison or pattern makes that finding believable?
What context is required to keep the claim fair?
Which audience segment would care most about this angle?
Which channel is the best first destination for it?
This small step changes the quality of the final output because it separates research review from design execution. Instead of asking a designer to "make the study visual," you give them a defined editorial unit.
That editorial unit might be:
one ranked comparison for LinkedIn
one punchy stat card for a faster feed
one five-slide carousel for Instagram
one methodology explainer for trust-sensitive audiences
This is also where teams discover whether a finding is actually visual-ready. Some ideas sound important inside a report but collapse when removed from the surrounding narrative. Others become stronger once isolated. A finding with a clear contrast, clean category structure, or obvious implication often works well. A finding that depends on too many caveats may be better reserved for the article body or caption.
The practical benefit is speed. When extraction happens first, review becomes faster because the team is evaluating a defined concept instead of an overstuffed draft. That makes infographic repurposing more repeatable and much less subjective.
Common mistakes and review gates
Good design review should not begin with color. It should begin with editorial accuracy.
Mistake: letting the template define the story
Templates are useful for production speed, but they should never decide which finding matters. If the template is doing the thinking, the infographic is probably under-edited.
Mistake: removing the caveat that keeps the claim honest
When a result depends on geography, timeframe, audience type, or sample boundaries, remove visual clutter before you remove the truth.
Mistake: turning everything into a carousel
Carousels are powerful, but not every idea needs one. Some insights are better as a single chart. Some are better as a stat card. Some should remain in long-form content.
Mistake: resizing instead of adapting
Changing the aspect ratio is not the same as rewriting the asset for a platform. The same finding may need different annotation, pacing, or supporting copy depending on where it is published.
Mistake: ignoring mobile readability
If the labels only work on a desktop monitor, the design is not finished. Social visuals live on phones first.
Before publishing, run a simple QA gate:
Is the main claim obvious in under three seconds?
Does the chart type match the data relationship?
Are labels, units, and comparisons accurate?
Is the claim still fair after simplification?
Does this version suit the channel where it will appear?
How to keep visuals honest while simplifying them
One of the hardest parts of infographic repurposing is deciding how much nuance can be removed without damaging the meaning of the original source.
Social graphics need compression, but compression should not become distortion. The safest rule is to preserve the minimum context required to keep the claim fair.
That often means keeping one or more of the following:
the timeframe
the measured audience or segment
the unit being compared
the baseline or ranking context
a short source note when needed
For example, “Email performs best” is vague and weak. “Email ranked highest for repeat-purchase influence in a Q1 customer survey” is still concise, but it preserves the framing that makes the claim meaningful.
Annotation also helps. A short note highlighting the most important bar, outlier, or trend break can reduce clutter elsewhere in the design. Good annotation clarifies. Bad annotation competes with the headline.
A useful test is this: if a skeptical reader asks, “According to what, for whom, and compared with what?” can the asset answer well enough without forcing them to leave the post?
A practical workflow from study to asset pack
Imagine a team publishes a report about what buyers want to see before booking a demo. The report contains ranked decision drivers, segment differences, and a brief methodology section.
Instead of creating one oversized infographic, the team builds a compact asset pack:
a LinkedIn chart on the top decision driver
an Instagram carousel on the three strongest findings
a stat card on the most surprising result
a methodology slide for trust
a later segment-specific variant for follow-up content
A practical workflow looks like this:
extract candidate findings from the report
shortlist only the findings that can survive compression
choose the right chart form before choosing a template
build platform-specific variants in Canva
review for clarity, fairness, and mobile readability
store approved versions with clear naming and tags
This is where Canva Integration + Media Library becomes useful in a restrained, believable way. Canva helps with production, versioning, and adaptation. The Media Library helps teams retrieve approved assets later, reduce duplicate work, and keep reusable visuals accessible across campaigns.
As asset volume grows, that operational layer matters more. The real bottleneck often stops being “Can we make this graphic?” and becomes “Can we find the right approved version quickly and reuse it confidently?”
That is also why this workflow connects naturally with broader publishing systems such as content batching for solopreneurs and small teams.
Quick FAQ
How many statistics should one social infographic include?
Usually fewer than teams expect. One core finding plus a small amount of supporting context is often enough. If the idea needs multiple numbers to stay honest, split it into a carousel or several separate assets.
What is the best chart type for social media?
There is no universal best chart. The right choice depends on whether the data is showing comparison, change over time, composition, or one standout result.
Should every data study become social graphics?
No. Some studies are better used in articles, webinars, sales material, or video explainers. Visual repurposing works best when the finding remains meaningful after compression.
How do you keep nuance in a short visual?
By deciding which context is non-negotiable. Often that means preserving a timeframe, a segment, a unit, or a short source note. Nuance does not always require more copy. It requires better editorial judgment.
Final verdict
The best Data Visualization Social Media workflow is not the one that produces the flashiest infographic. It is the one that turns a real finding into a visual asset that is clear, honest, reusable, and suited to the platform where it appears.
If you move from report to template too quickly, the result is usually clutter. If you isolate the signal first, rank the story, choose the correct visual form, and adapt the output by channel, your research becomes far more useful.
That is the real value of visual repurposing. It is not decoration. It is a disciplined way to extract more editorial value from the work your team already did.
And when the number of assets grows, workflow discipline matters as much as design quality. A setup that connects Canva-based creation with an organized Media Library will not magically improve performance, but it can make the process cleaner: faster retrieval, fewer duplicate assets, and a more dependable path from data study to social-ready infographic.