A social media KPI dashboard should not be a wall of numbers.
It should help your team make decisions.
The problem with many dashboards is that they look complete but do not change the workflow.
They show reach, impressions, followers, engagement rate, clicks, comments, and top posts.
But they do not answer:
what should we repeat?
what should we repurpose?
what should we stop?
what should we test?
what should go into next month’s plan?
what should the client approve next?
what should become a blog, landing page, or sales asset?
A better dashboard connects metrics to content actions. That is where analytics reports need to plug back into execution instead of stopping at presentation.
This template helps creators, agencies, SaaS teams, startups, and content teams build a social media KPI dashboard that leads to decisions.
TL;DR
A useful social media KPI dashboard should include:
executive summary
awareness metrics
engagement quality
traffic and conversion
content format performance
platform performance
top posts and weak posts
repurposing candidates
approval and workflow metrics
next actions
The key rule:
Every dashboard should end with decisions, owners, and next steps.
If a dashboard does not create action, it is only a report.
What is a social media KPI dashboard?
A social media KPI dashboard is a structured view of the metrics that matter for your social media strategy.
It usually tracks:
reach
impressions
follower growth
engagement
saves
shares
comments
clicks
watch time
conversion
top posts
platform performance
campaign performance
But a good KPI dashboard also tracks workflow output.
Examples:
approved posts
delayed approvals
scheduled posts
published posts
repurposing candidates
content backlog
reporting actions
high-performing posts reused
This matters because social media performance is connected to operations.
If approvals are late, publishing suffers. Teams that measure review friction directly inside approval workflows catch that problem faster.
If top posts are not repurposed, content leverage is lost. A connected repurposing workflow makes the KPI dashboard operational instead of passive.
If reports do not create tasks, insights disappear.
The KPI framework
Use this KPI framework:
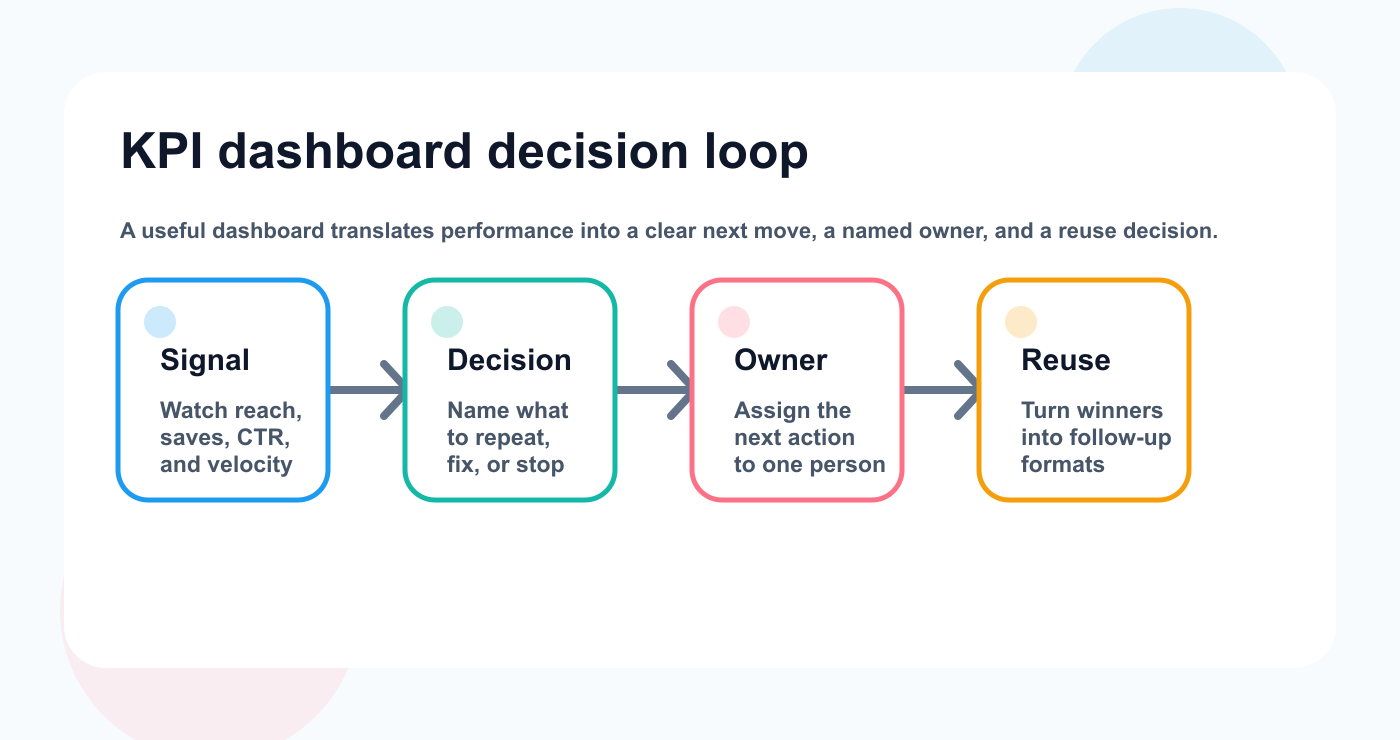
A KPI dashboard becomes useful when every metric ends in a next move, a named owner, and a reuse decision.
K — Key business goal
P — Performance signal
I — Implementation action
A metric only matters if it connects to a goal and action.
Example:
GoalSignalActionGrow awarenessReach above baselineRepeat formatDrive trafficHigh clicksExpand topic into blogImprove engagementHigh commentsCreate FAQ postBuild content leverageHigh savesAdd to repurposing queueImprove operationsApproval delaysAdjust review process
This creates a dashboard that is useful.
Dashboard sections
Section 1: Executive summary
Start the dashboard with a simple summary.
Executive summaries work when readers can scan the signal and decide what changes next.
Use this format:
## Executive Summary

Period:
Primary goal:
Best-performing platform:
Best-performing format:
Top content theme:
Biggest issue:
Main recommendation:
Next action owner:
Example:
Period: May 2026
Primary goal: Increase qualified traffic from social
Best-performing platform: LinkedIn
Best-performing format: text post with tactical framework
Top content theme: workflow automation
Biggest issue: approval delays reduced posting volume
Main recommendation: repurpose top LinkedIn post into carousel and blog section
Next action owner: Content Lead
This helps stakeholders understand the dashboard quickly. It also creates a shared language for what moves into the next publishing cycle.
Section 2: Awareness KPIs
Awareness metrics show whether content is reaching people.
Track:
reach
impressions
follower growth
profile visits
video views
audience growth by platform
Dashboard table:
MetricCurrent periodPrevious periodChangeDecisionReachImpressionsFollower growthProfile visits
Decision examples:
Repeat high-reach format.
Improve hooks if reach is down.
Repurpose broad posts into platform-specific versions.
Review posting frequency if impressions dropped.
Awareness is useful, but it is not the whole story.
Section 3: Engagement quality KPIs
Engagement quality is more useful than engagement volume.
Track:
saves
shares
comments
replies
watch time
completion rate
meaningful comments
DM triggers if relevant
Dashboard table:
PostSavesSharesCommentsSignalNext action
Signals:
high saves = useful content
high shares = identity, opinion, or practical value
high comments = questions, objections, or strong response
high watch time = hook/pacing worked
Engagement should feed content decisions.
Section 4: Traffic and conversion KPIs
Traffic metrics matter when social supports business outcomes.
Track:
link clicks
click-through rate
landing page visits
trials
signups
demo requests
purchases
assisted conversions
UTM performance
Dashboard table:
PlatformClicksCTRConversion actionDecisionLinkedInPinterestInstagramTikTok
Decision examples:
high clicks -> create deeper landing page
low clicks but high saves -> improve CTA
high traffic but low conversion -> review page match
strong platform traffic -> increase publishing there
For SaaS teams, traffic and conversion metrics are especially important.
Section 5: Content format performance
Different formats do different jobs.
Track performance by:
text posts
short-form video
carousels
images
stories
pins
threads
product demos
founder posts
educational posts
Dashboard table:
FormatPosts publishedBest metricWeaknessDecisionCarouselShort videoText postPin
This helps the team decide format strategy.
A format with fewer posts but better saves may deserve more attention.
A high-reach format with low clicks may need better CTAs.
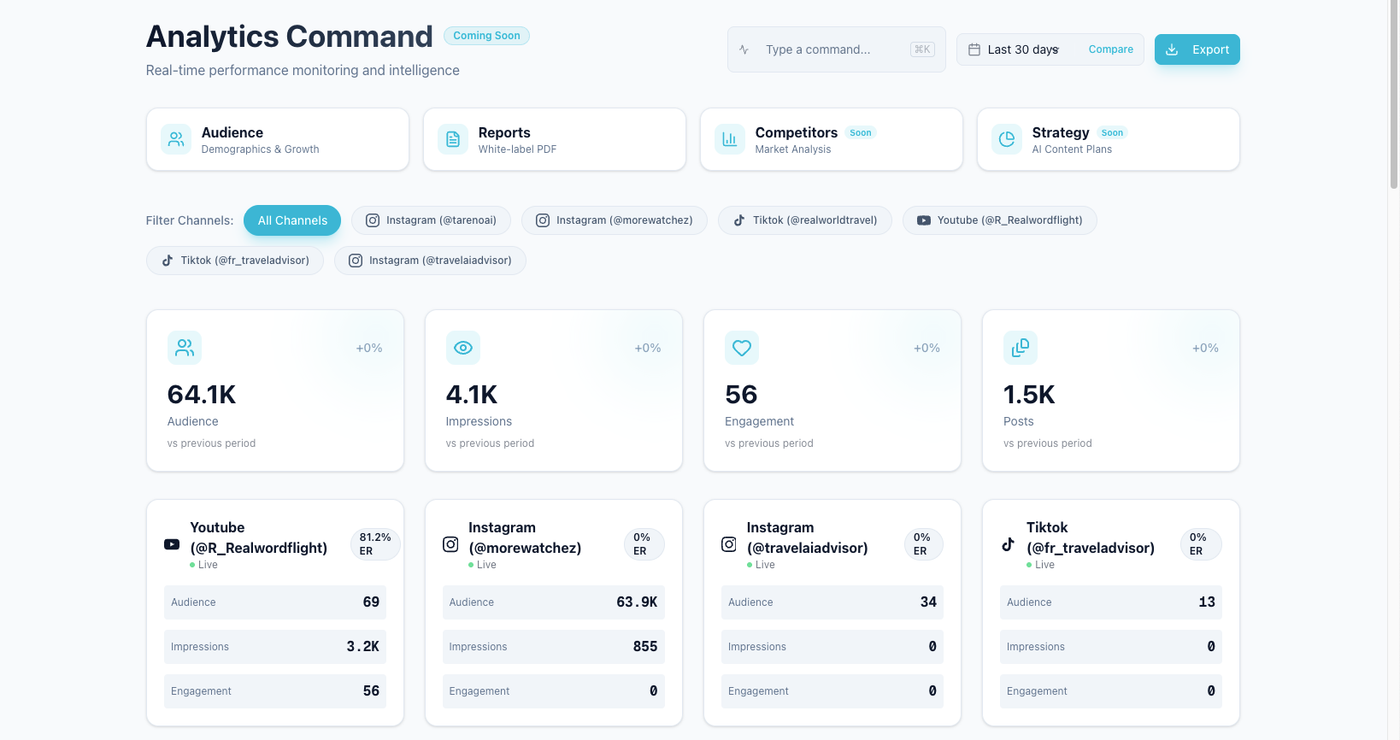
Section 6: Platform performance
Track platforms separately.
Platform comparisons are clearer when each channel is visible in one view instead of being buried in separate exports.
Platform comparisons are clearer when each channel is visible in one view instead of being buried in separate exports.
A strong dashboard compares:
Instagram
TikTok
LinkedIn
Threads
YouTube
Pinterest
Facebook
X / Twitter
Dashboard table:
PlatformPostsReachEngagement signalTraffic signalDecisionInstagramTikTokLinkedInPinterest
Do not expect every platform to do the same job.
LinkedIn may drive business discussion.
Pinterest may drive search traffic.
TikTok may test hooks.
Instagram may build brand familiarity.
Threads may test opinions quickly.
Section 7: Top posts and weak posts
Every dashboard should show top posts and weak posts.
Top posts table
PostPlatformSignalWhy it workedNext action
Weak posts table
PostPlatformIssuePossible reasonNext action
Do not only celebrate top posts.
Weak posts can reveal:
wrong format
weak hook
poor timing
unclear CTA
platform mismatch
topic fatigue
approval delays
asset quality issues
The goal is learning.
Section 8: Repurposing candidates
This is one of the most important dashboard sections.
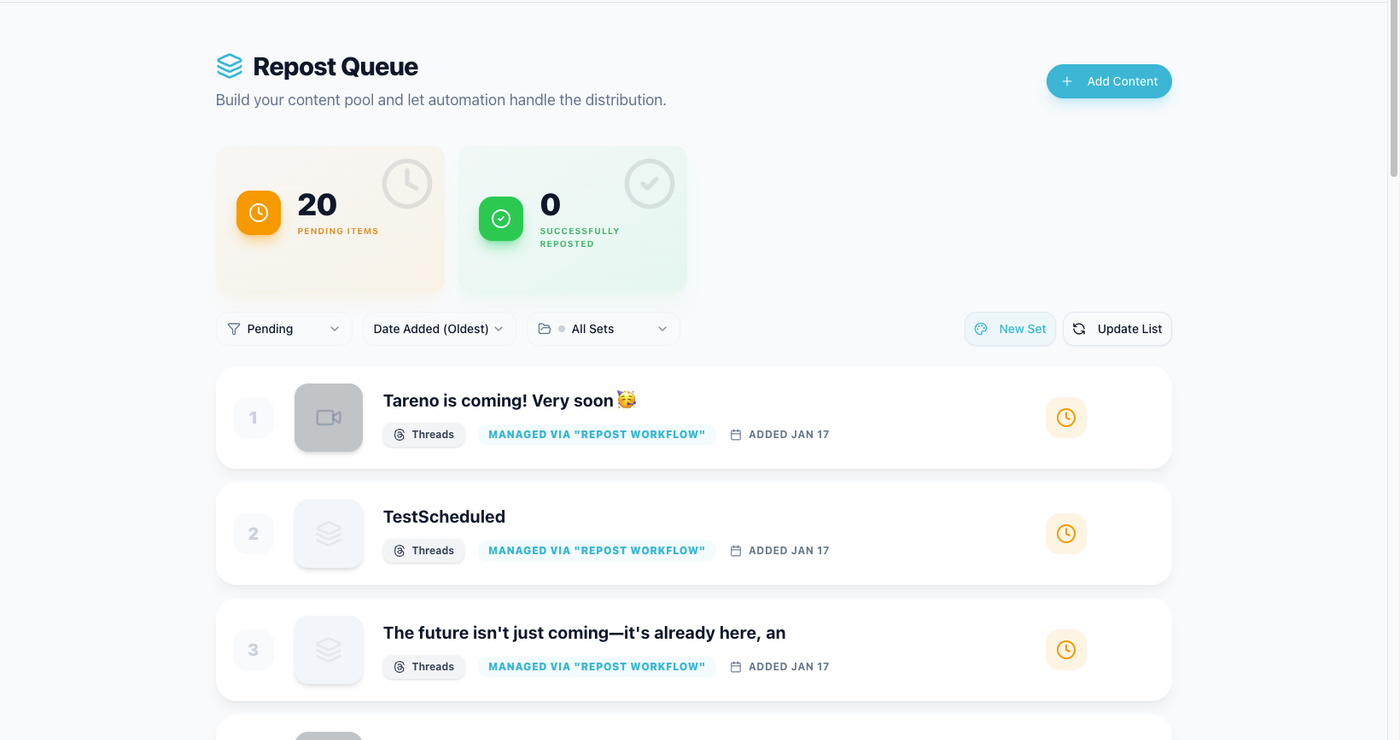
A KPI dashboard should identify which winners deserve a second life instead of treating every top post as finished work.
A high-performing post should not disappear.
Repurposing table:
Source postSignalTarget platformNew formatOwnerStatusHigh savesPinterestPinDraftHigh clicksBlogSectionReviewHigh watch timeYouTubeShortScheduled
Repurposing decisions:
turn into carousel
rewrite for LinkedIn
create TikTok script
create Pinterest pin
create blog section
create FAQ
create follow-up series
add to evergreen queue
This turns reporting into output.
Section 9: Workflow KPIs
Most dashboards ignore workflow metrics.
Workflow KPIs matter because performance often drops when drafts, approvals, or scheduling stages start to stall.
That is a mistake.
Workflow metrics explain why performance happened.
Track:
posts planned
posts published
posts delayed
average approval time
posts awaiting review
posts awaiting assets
repurposing tasks created
repurposing tasks published
reports completed
next actions assigned
Workflow dashboard table:
Workflow KPICurrent periodIssueActionPlanned postsPublished postsDelayed approvalsRepurposing tasks completed
If publishing volume dropped, the cause may not be strategy.
It may be approvals.
Section 10: Next actions
End every dashboard with actions.
A KPI review only matters when the next content actions are captured in a queue that someone owns.
A KPI review only matters when the next content actions are captured in a queue that someone owns.
Use this format:
ActionOwnerDue dateSource insightRepurpose top LinkedIn post into carouselContent LeadFridayHigh clicksFix CTA on Instagram carouselsSocial ManagerNext weekSaves high, clicks lowCreate blog from recurring commentsWriterMondayComment patternShorten approval deadlineAccount ManagerThis monthDelayed approvals
This is what makes the dashboard operational.
Dashboard cadence
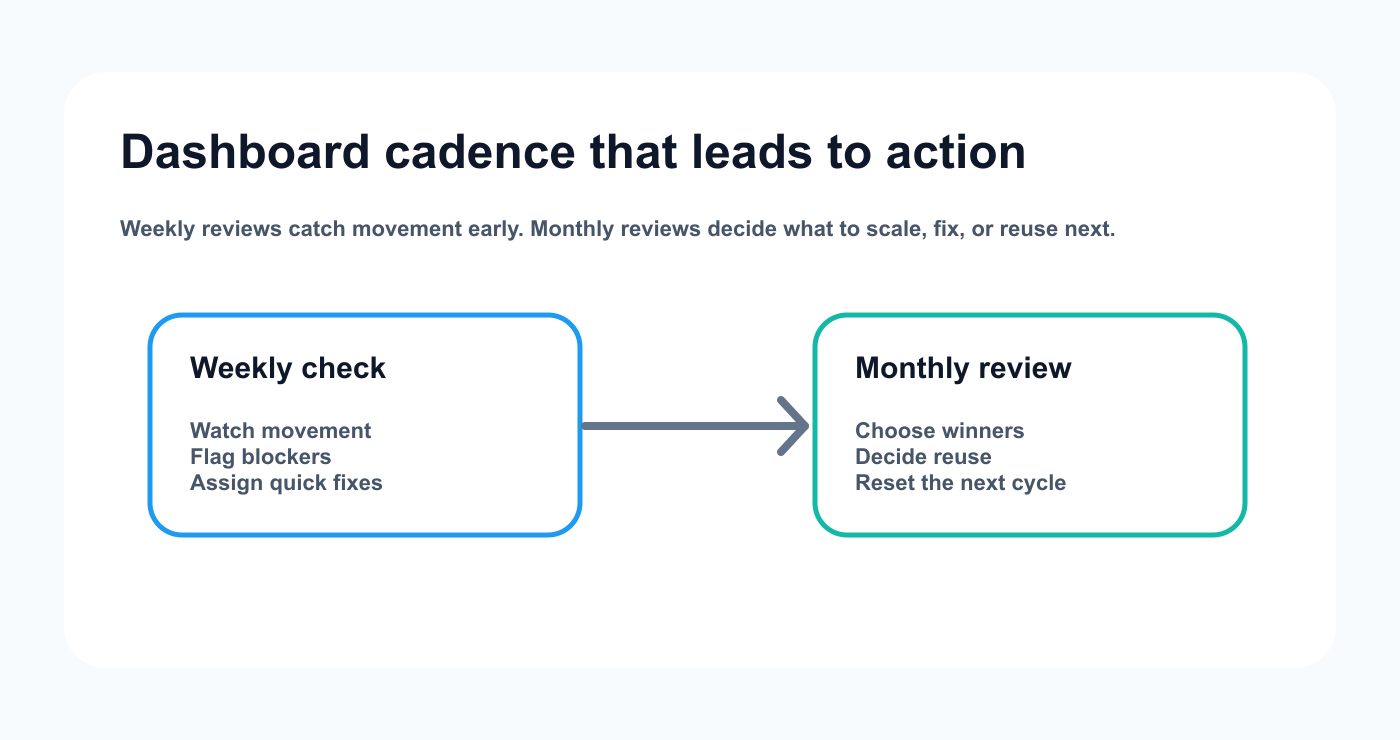
A simple review rhythm helps teams move from monitoring to actual content decisions without waiting for a quarterly recap.
Use different dashboard frequencies.
Weekly dashboard
Best for:
creators
social managers
small teams
Focus:
top posts
next posts
quick decisions
repurposing candidates
Monthly dashboard
Best for:
agencies
SaaS teams
content teams
Focus:
platform performance
campaign performance
client recommendations
repurposing plan
workflow bottlenecks
Quarterly dashboard
Best for:
strategy reviews
Focus:
format strategy
platform investment
team workflow
content themes
conversion impact
tool effectiveness
How to automate dashboard workflows
Automation can reduce manual reporting.
Useful automations:
published post -> add row to tracker
wait 7 days -> create measurement task
high-performing post -> add to repurposing queue
monthly report completed -> create next actions
approval delay -> notify owner
repurposed post published -> measure again
Make/n8n workflow -> sync data to dashboard
API workflow -> export metrics to internal system
Automation should not replace interpretation.
It should reduce manual copying.
How Tareno fits KPI dashboards
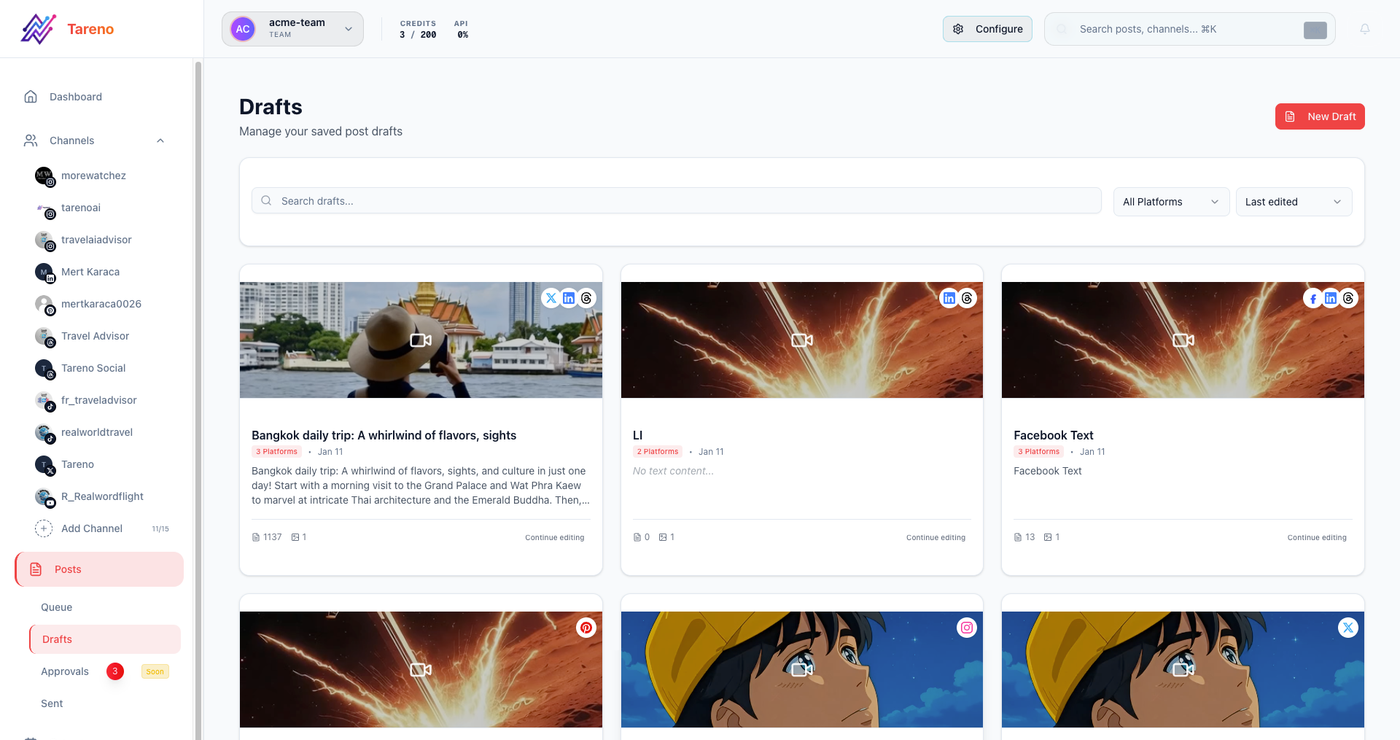
Tareno is useful when KPI dashboards need to connect with workflow actions.
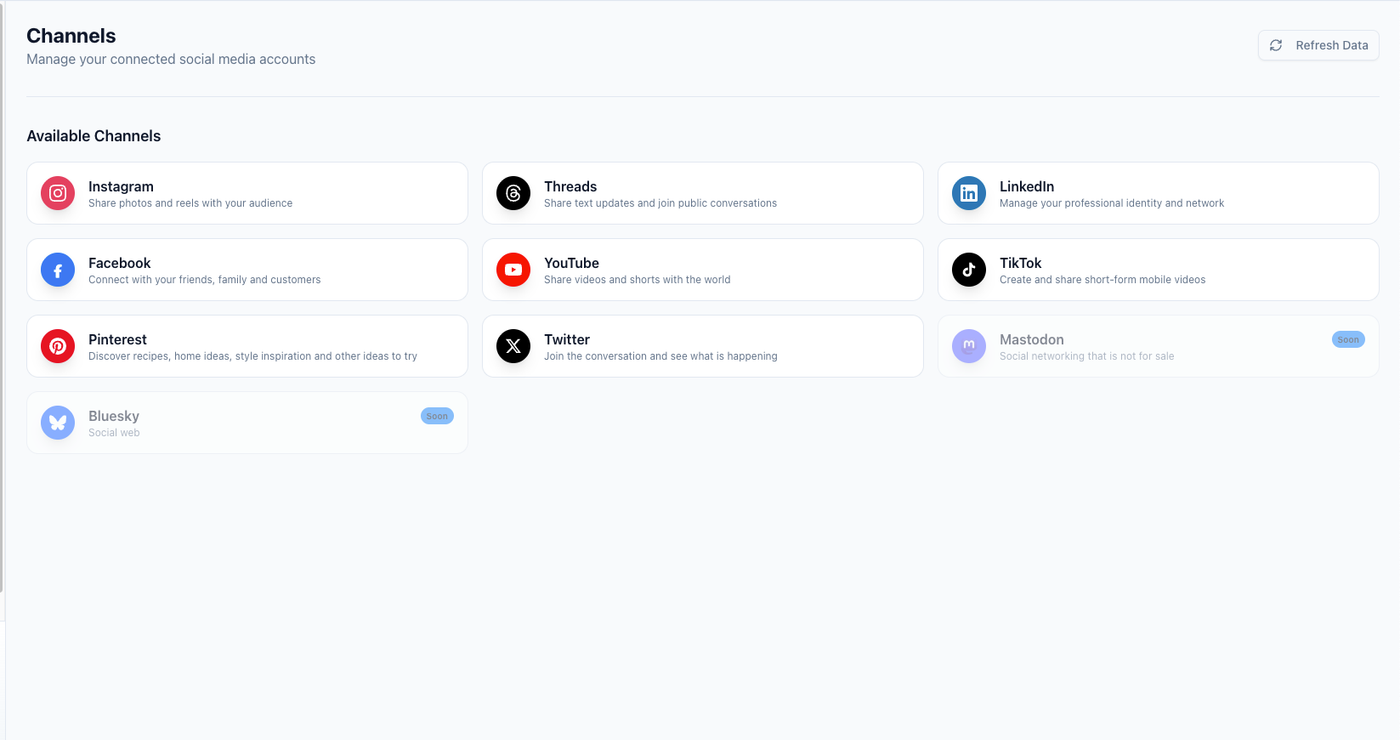
Relevant Tareno components include:
analytics
competitor analysis
content boards
approval workflows
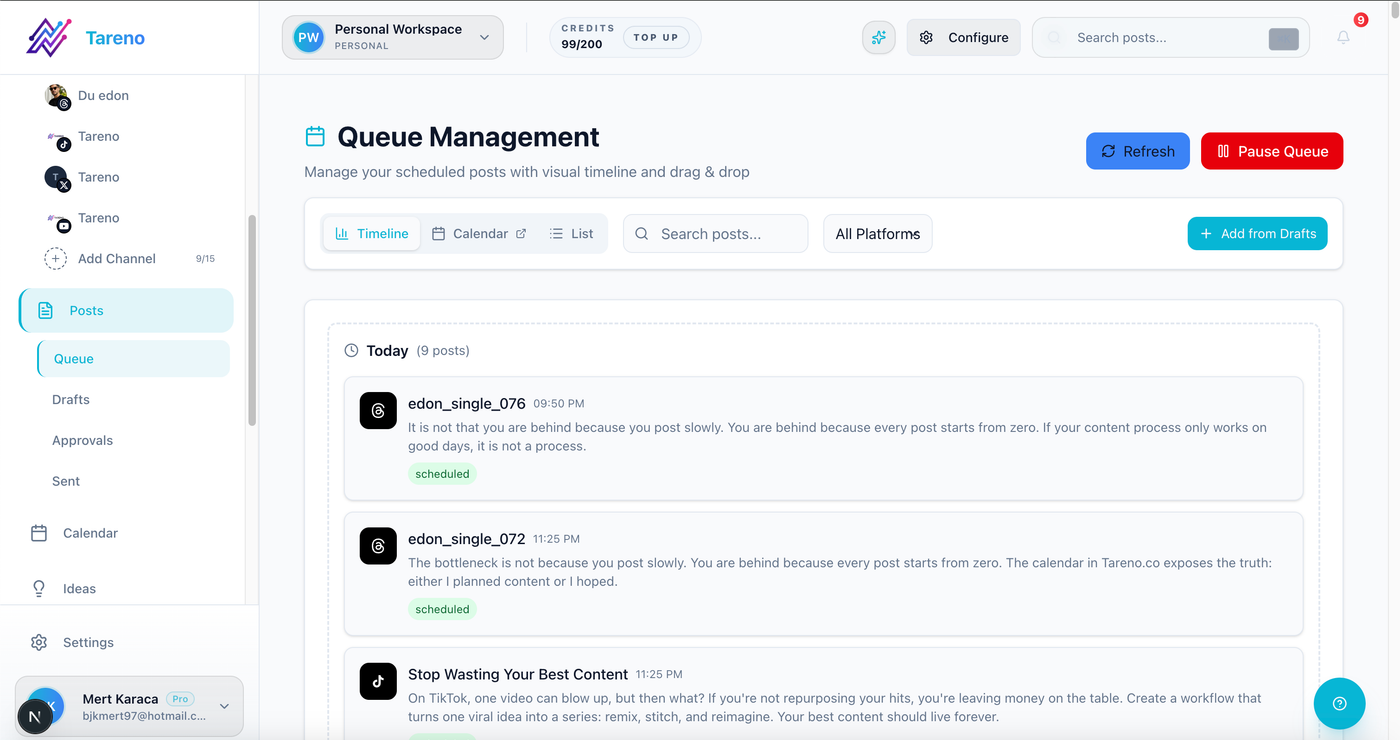
repurposing queue
content calendar
workflow builder
team workspaces
roles and permissions
activity visibility
AI captions and hashtags
Make integration
n8n integration
API access
This matters because the best dashboard does not stop at metrics.
It creates workflow actions:
KPI -> Signal -> Decision -> Owner -> Task -> Publish -> Measure again
Copy/paste dashboard template
## Social Media KPI Dashboard

Period:
Primary goal:
Main recommendation:
Owner:

### Awareness
- Reach:
- Impressions:
- Follower growth:
- Profile visits:

### Engagement Quality
- Saves:
- Shares:
- Comments:
- Replies:
- Watch time:

### Traffic / Conversion
- Clicks:
- CTR:
- Signups / Trials / Demos:
- Top traffic platform:

### Content Performance
- Best format:
- Weakest format:
- Best topic:
- Weakest topic:

### Top Posts
1.
2.
3.

### Weak Posts
1.
2.
3.

### Repurposing Candidates
1.
2.
3.

### Workflow KPIs
- Planned posts:
- Published posts:
- Delayed approvals:
- Repurposing tasks completed:

### Next Actions
- Action:
- Owner:
- Due date:
Use this as your starting point.
Common dashboard mistakes
Mistake 1: Tracking too many metrics
More metrics can make decisions harder.
Mistake 2: No baseline
Compare performance against the right baseline.
Mistake 3: No next action section
A dashboard should create work.
Mistake 4: Ignoring workflow metrics
Performance issues often come from operational bottlenecks.
Mistake 5: No repurposing section
Top posts should become future content.
Mistake 6: Treating all platforms the same
Each platform may serve a different strategic role.
Related Tareno resources
Keep the workflow moving
Feature Analytics & Reports See how reporting can connect directly to planning decisions. Explore reports -> Workflow Repurposing Workflow Use performance signals to decide what deserves a second life. Open workflow -> Feature Approval Workflows Track approval delays and quality gates as part of operational KPIs. See approvals -> Alternative Metricool Alternative Compare analytics-heavy tooling with workflow-first reporting setups. Compare options ->
FAQ
What should be included in a social media KPI dashboard?
Include awareness metrics, engagement quality, traffic, conversion, format performance, platform performance, top posts, weak posts, repurposing candidates, workflow KPIs, and next actions.
What are the most important social media KPIs?
The most important KPIs depend on your goal. Awareness uses reach and impressions. Engagement uses saves, shares, comments, and watch time. Traffic uses clicks. Conversion uses signups, trials, demo requests, or purchases.
How often should you review social media KPIs?
Creators and social managers can review weekly. Agencies and teams often review monthly. Strategy-level reviews can happen quarterly.
What is the difference between a report and a KPI dashboard?
A report often summarizes what happened. A KPI dashboard should help the team make decisions and track ongoing performance.
Should repurposing be part of a KPI dashboard?
Yes. Top-performing content should be reviewed for repurposing so strong ideas can become future posts, videos, pins, carousels, or blog sections.
Can KPI dashboards be automated?
Yes. Make, n8n, API workflows, and reporting integrations can help update dashboards, create measurement tasks, and trigger repurposing workflows.
Final thoughts
A social media KPI dashboard should make decisions easier.
It should not overwhelm the team with numbers.
Track the metrics that matter.
Interpret the signals.
Assign next actions.
Repurpose winners.
Fix workflow bottlenecks.
That is how a dashboard becomes part of a real social media operating system.
Primary CTA: Explore Tareno features to see how analytics, boards, approval workflows, repurposing queues, workflow builder, Make, n8n, API, roles, and activity visibility help turn KPIs into action.
Secondary CTA: Compare Tareno with analytics and reporting tools on the compare hub.