Social media reporting is useful.
But reporting alone does not improve social media performance.
A dashboard can show which posts performed best.
A report can show follower growth.
A chart can show engagement rate.
A competitor report can show what other brands are doing.
But none of that matters if the team does not turn the insight into a next action.
That is the gap most social media teams have.
They measure performance, but they do not operationalize it.
They create reports, but the reports do not change the workflow.
They identify winning posts, but do not repurpose them.
They see competitor patterns, but do not turn them into content ideas.
They review analytics, but do not assign tasks.
A strong social media reporting workflow does not end with a PDF, chart, or analytics dashboard.
It ends with action.
This guide explains how to turn social media reporting into a repeatable workflow for content decisions, repurposing, approvals, competitor analysis, team accountability, and automation.
TL;DR
Social media reporting is not enough because reports only describe what happened.
To improve performance, teams need a workflow that turns reporting into action.
A strong reporting-to-action workflow includes:
collect performance data
identify the insight
decide the next action
assign an owner
move the action into a workflow board
approve or adapt the content
publish or repurpose
measure again
The key rule:
If a report does not create a decision, task, repurposing action, or workflow change, it is only a record.
The best social media teams use analytics as an operating input, not just a reporting output.
What social media reporting can and cannot do
Social media reporting can answer important questions.
It can show:
which posts got reach
which posts got saves
which videos got watch time
which posts generated clicks
which platforms grew
which campaigns performed
which competitors gained attention
which content formats worked
which posting times performed
which audience segments responded
That is useful.
But reporting cannot automatically answer:
what should we create next?
who should act on this insight?
should this post be repurposed?
should this hook become a template?
should this competitor pattern become a campaign?
should this content be rewritten for another platform?
should this idea move into the content calendar?
should this claim be updated before reuse?
Those are workflow questions.
A report can show the signal.
A workflow turns the signal into execution.
The reporting trap
Many teams fall into the same trap:
collect data
build a report
send the report
discuss the report
do the same content process again
Nothing changes.
The report becomes a ritual.
A monthly report may look professional, but if it does not change next month’s content, it is not helping enough.
The reporting trap usually happens for five reasons:
1. The report has too many metrics
Too many metrics make it hard to decide what matters.
If everything is measured, nothing is prioritized.
2. The report has no owner
If no one owns the next action, the insight disappears.
3. The report is disconnected from planning
If reporting lives in one tool and content planning lives somewhere else, the insight does not move.
4. The report does not include recommendations
A report should not only say what happened.
It should say what should happen next.
5. The report does not trigger repurposing
High-performing content should not be left in the past.
It should feed the next content cycle.
The ACTION framework for social media analytics
Use the ACTION framework to turn social media reporting into execution.
A — Analyze what moved
C — Classify the insight
T — Turn insight into a task
I — Integrate with workflow
O — Optimize through repurposing
N — Normalize the loop
This turns analytics from a passive dashboard into a content operating system.
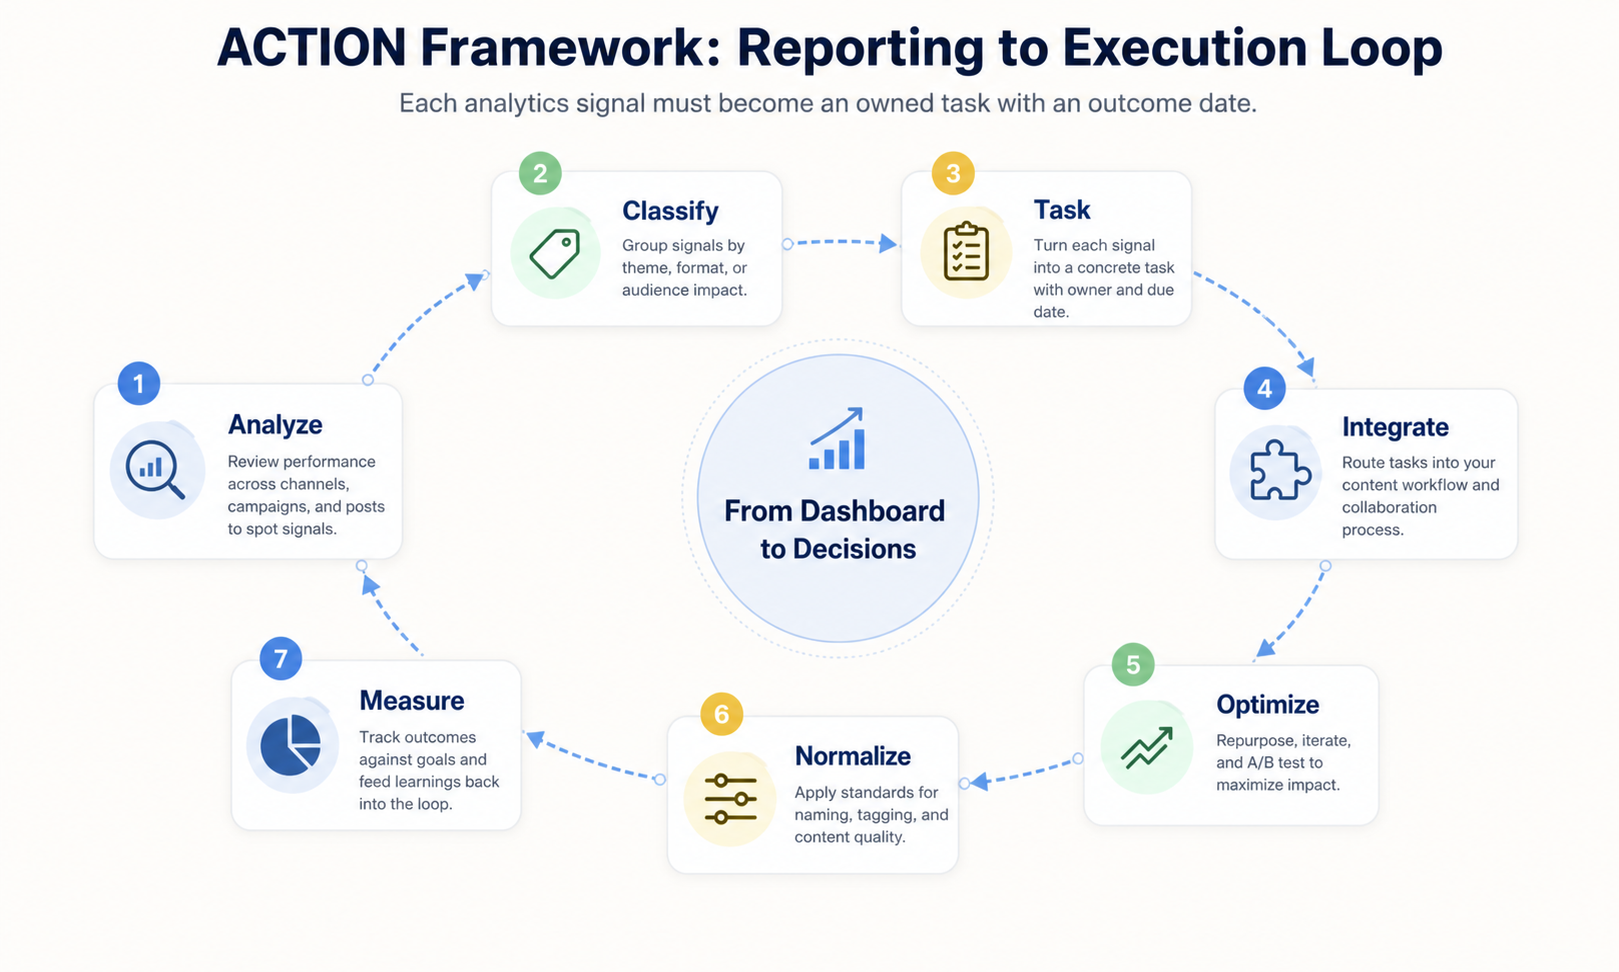
ACTION framework loop for converting analytics insights into owned execution tasks.
A — Analyze what moved
Start by identifying what actually changed.
Do not review every metric equally.
Focus on movement.
Ask:
Which posts outperformed the baseline?
Which posts underperformed?
Which formats changed performance?
Which platforms gained or lost traction?
Which topics created saves, comments, or clicks?
Which competitor posts gained unusual engagement?
Which content types created meaningful replies?
Which post should be reused?
Which post should not be repeated?
You are not looking for data.
You are looking for signals.
A signal is a metric that suggests a decision.
Example:
“This post got 3x more saves than average.”
“This hook produced the highest watch time this month.”
“This competitor’s tutorial posts are consistently outperforming their promotional posts.”
“Our repurposed LinkedIn version drove more clicks than the original Instagram post.”
“Pinterest pins based on blog sections are creating more search traffic.”
Each of these signals can become an action.
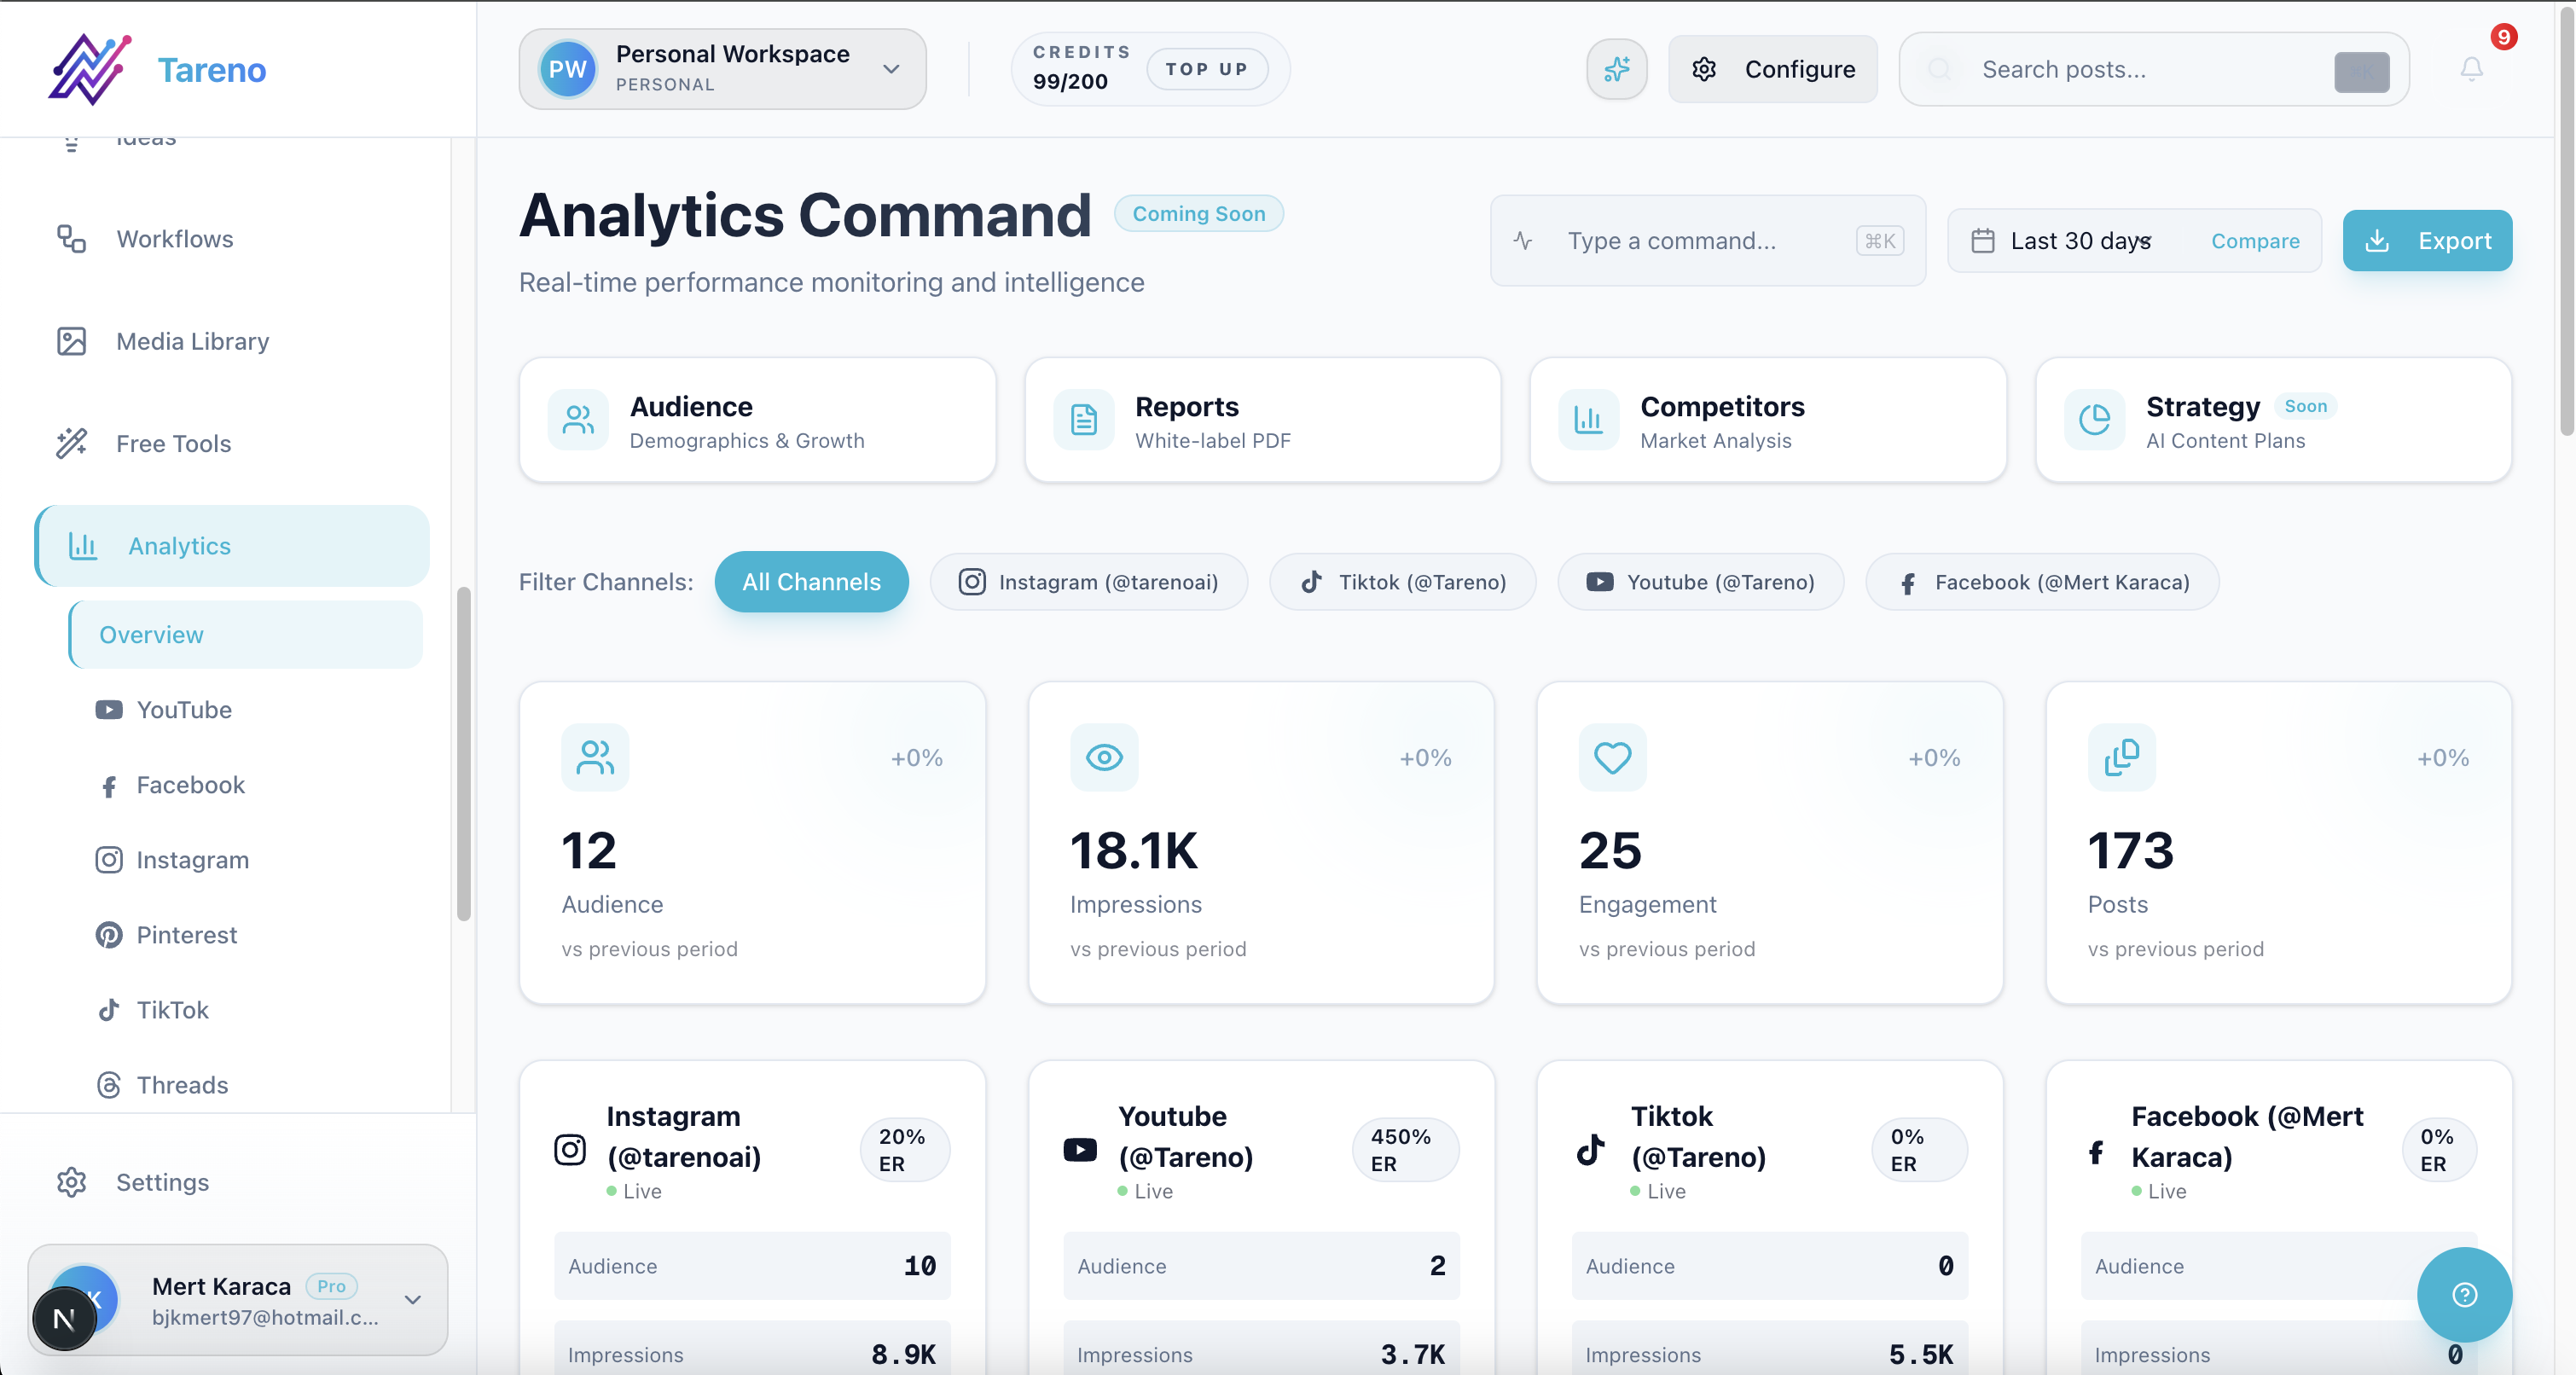
Analytics dashboard view used to identify outliers before assigning next actions.
C — Classify the insight
Not every insight needs the same action.
Classify each insight by type.
Content winner
A post performed well enough to reuse.
Action:
move to repurposing queue
create platform-specific versions
test a follow-up post
turn into a carousel, short video, or Pinterest pin
Content loser
A post performed worse than expected.
Action:
identify weak hook
check platform fit
check timing
check creative
avoid repeating the same format without changes
Format signal
A format performed better than others.
Action:
create more content in that format
build a reusable template
test the format on another platform
Topic signal
A topic attracted audience attention.
Action:
create a content cluster
create a blog
make a comparison page
build a recurring content series
Competitor signal
A competitor is gaining traction with a specific topic, format, or angle.
Action:
analyze why it works
create a better, more specific version
add missing angles
create a workflow around the topic
Conversion signal
A post generated clicks, sign-ups, demo requests, or qualified attention.
Action:
repurpose it
link it to a landing page
create a follow-up sequence
turn it into a paid test
add it to the content playbook
The goal is to avoid vague conclusions.
“Engagement was good” is not enough.
A useful insight says:
This worked, here is why, and here is what we will do next.
T — Turn insight into a task
Insights disappear when they do not become tasks.
A good reporting workflow turns insights into clear actions.
Bad reporting note:
Reels performed well this month.
Better task:
Create 3 new Reels using the same “before/after caption” format. Owner: Sarah. Due: Friday. Review required before scheduling.
Bad reporting note:
Competitor tutorials are performing well.
Better task:
Analyze top 5 competitor tutorial posts and create a Tareno workflow automation tutorial series. Owner: Content Lead. Due: next planning meeting.
Bad reporting note:
LinkedIn had good clicks.
Better task:
Repurpose the top Instagram workflow post into a LinkedIn founder-style post and link to the workflow automation blog. Owner: Social Lead. Due: Wednesday.
The difference is ownership.
Every action should include:
what to do
why it matters
owner
due date
destination
approval requirement
internal link or landing page
measurement plan
A report without tasks is a summary.
A report with tasks is a workflow.
I — Integrate with workflow
The next step is to move the action into the content workflow.
This is where many teams break down.
The report lives in analytics.
The content workflow lives in a calendar.
The tasks live in a project management tool.
The approvals live in Slack.
The repurposing ideas live in someone’s notes.
That fragmentation kills execution.
A better system connects reporting to workflow stages.
Example workflow:
Reporting review identifies a winning post.
The post is added to “Repurpose Candidates.”
Owner selects target platforms.
Captions are rewritten per platform.
Repurposed content moves to review.
Approved content moves to scheduled.
Results are measured again.
This is how reporting becomes execution.
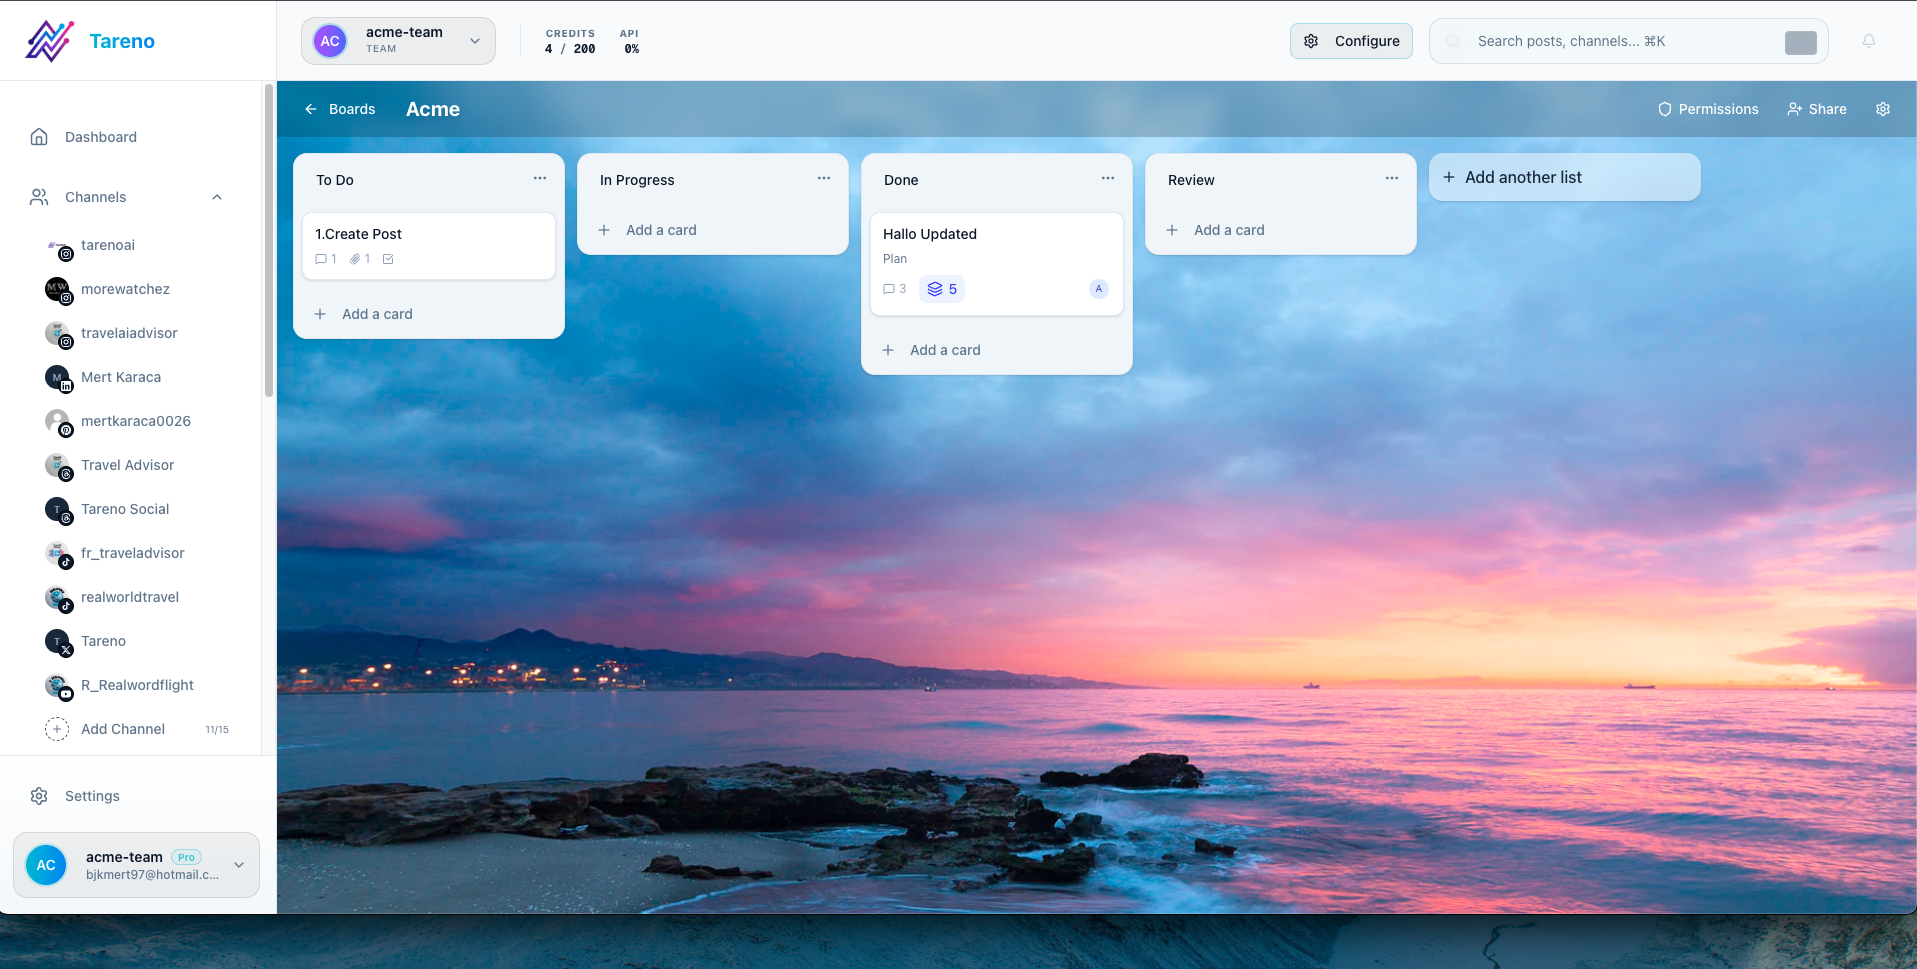
Analytics actions moved into a shared board so insights become assigned work items.
O — Optimize through repurposing
Repurposing is one of the most useful ways to turn analytics into action.
If a post performs well, do not let it disappear.
Repurpose it.
Possible actions:
turn a strong TikTok into a LinkedIn post
turn a LinkedIn insight into a carousel
turn a blog section into a Pinterest pin
turn a high-save Instagram post into a Reel
turn a customer question into a Threads post
turn a competitor insight into a comparison page
turn a successful tutorial into a short video series
The goal is not to duplicate.
The goal is to adapt.
A reporting workflow should ask:
what worked?
why did it work?
where else could this idea work?
what format should it become?
what needs to change for the new platform?
who should approve it?
when should it be published?
how will we measure the second version?
That turns analytics into compounding content value.
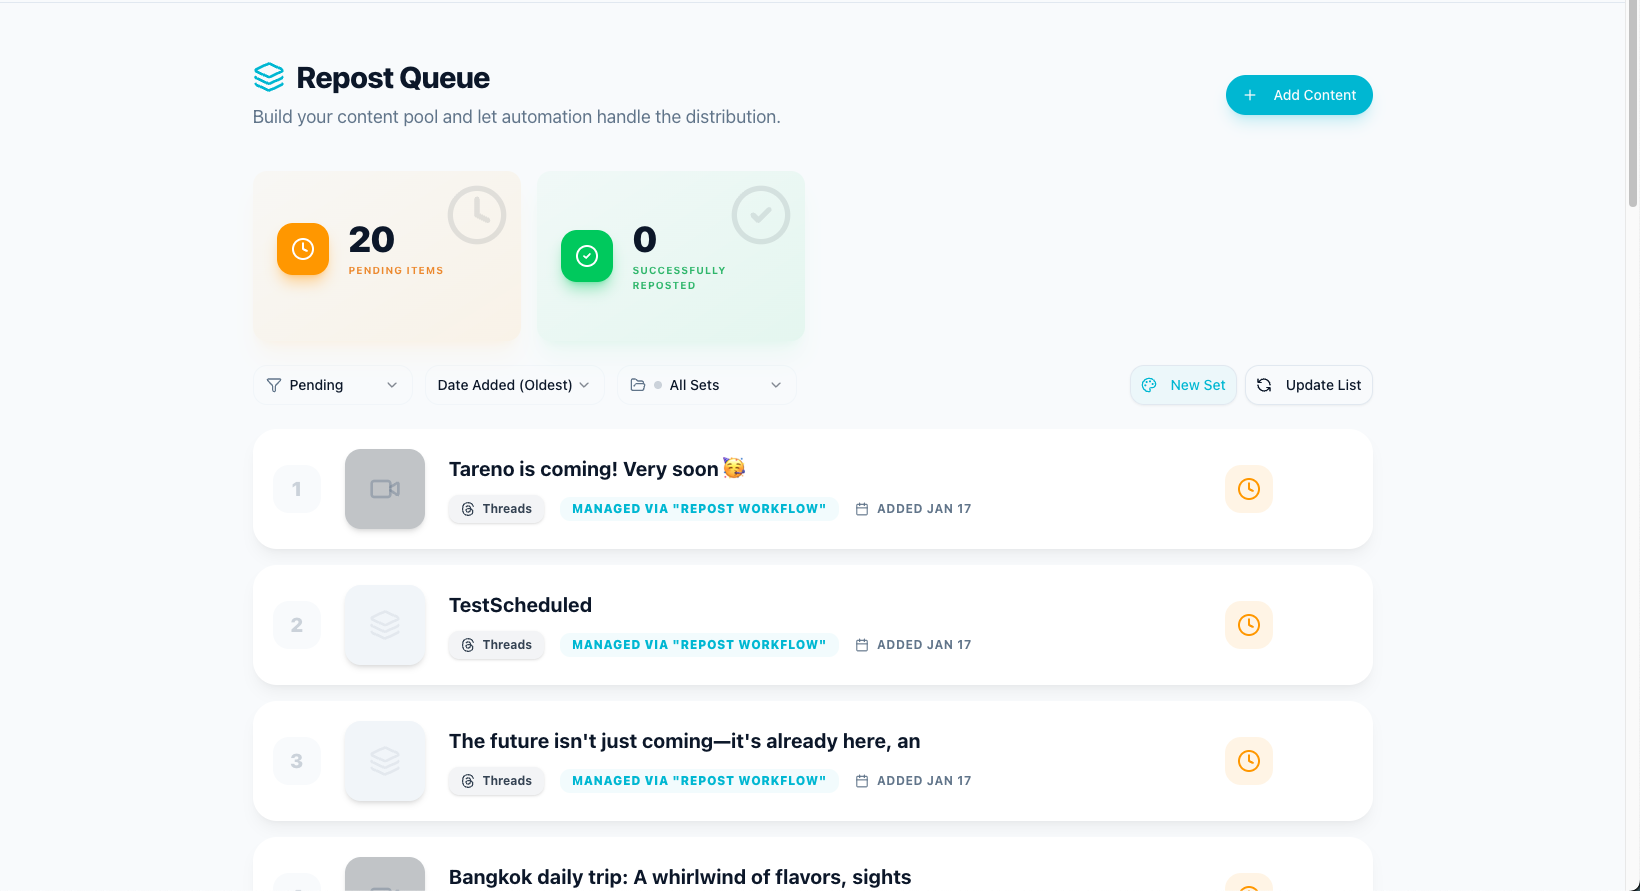
Repurposing queue keeps winning posts active across channels and review cycles.
N — Normalize the loop
Reporting should be a loop, not a one-time meeting.
A strong reporting loop looks like this:
measure performance
identify signals
create actions
move actions into workflow
publish or repurpose
measure again
update playbook
repeat
The loop gets stronger over time.
Your team learns:
which hooks work
which formats work
which topics convert
which platforms deserve more effort
which posts should be repurposed
which competitors are worth monitoring
which workflows create the best results
This is how social media becomes more predictable.
Not perfectly predictable.
But more systematic.
Reporting workflow for creators
Creators often review analytics casually.
They look at views, likes, and comments, then move on.
A better creator workflow:
Every Friday, review top posts.
Pick 3 winners.
Add winners to repurposing queue.
Create one platform-specific version per winner.
Rewrite hooks.
Schedule the next wave.
Track which repurposed version performs best.
Example:
TikTok video gets strong watch time.
Creator turns it into an Instagram Reel.
Main idea becomes a Threads post.
The lesson becomes a Pinterest pin.
The strongest comment becomes a follow-up post.
That is how creators get more output without more idea pressure.
Reporting workflow for agencies
Agencies often create reports for clients.
But a client report should not only prove work happened.
It should guide the next month.
A better agency reporting workflow:
Pull monthly performance.
Identify top content by goal.
Identify underperforming formats.
Identify competitor patterns.
Create next-month recommendations.
Turn recommendations into content tasks.
Assign owners.
Route through approval.
Add winning posts to repurposing queue.
Include the action plan in the client report.
This makes reporting more valuable.
Instead of saying:
Here is what happened.
The agency can say:
Here is what happened, here is what it means, and here is what we will do next.
That is a stronger client experience.
Reporting workflow for social teams
Social teams need reporting that improves the operating system.
A weekly team workflow might look like:
Social lead reviews performance.
Top posts are tagged by pattern.
Weak posts are reviewed for reason.
Competitor signals are summarized.
New tasks are created.
Repurposing candidates are assigned.
Approval requirements are checked.
Posts are scheduled.
Results are measured in the next cycle.
The team should leave the reporting review with fewer questions, not more.
Clear outputs:
3 posts to repurpose
2 hooks to test again
1 format to pause
1 competitor pattern to respond to
1 landing page to link more often
1 workflow improvement
That is actionable reporting.
Competitor analysis should create content actions
Competitor analysis is useful only if it changes what you do.
Bad competitor analysis:
Competitor X got a lot of engagement.
Better competitor analysis:
Competitor X is getting engagement on short tutorial posts. We will create a more specific tutorial series focused on workflow automation for creators and link it to our Tareno features page.
Competitor insights can become:
blog topics
comparison pages
short-form scripts
carousel ideas
landing page sections
FAQ updates
feature positioning
YouTube Shorts
Pinterest pins
Reddit discussion angles
The key is not to copy.
The key is to understand the intent behind what is working and create something more useful.
Reporting should improve internal linking
For SEO and GEO, reporting can also improve content architecture.
If a post, blog, or page gets impressions for a related topic, that signal can become an internal linking action.
Example:
A blog about workflow automation starts getting queries around “approval workflow.”
Action:
add a section about approval workflows
link to the social media approval workflow blog
link to Planable Alternative
link to Tareno Features
add FAQ about approvals
Another example:
A comparison page gets impressions for “Metricool pricing.”
Action:
create or improve Metricool Pricing page
link from Metricool Alternative
link from Metricool vs Later
add pricing verification screenshot
add monthly vs annual pricing note
Reporting should feed internal linking.
This makes the site stronger over time.
How to connect reporting with Make and n8n
Reporting workflows can be automated once the decision rules are clear.
Example Make workflow:
trigger: weekly analytics export
action: identify posts above threshold
action: add them to a repurposing sheet or board
action: notify content owner
action: create review task
Example n8n workflow:
trigger: post performance update
action: if engagement rate exceeds benchmark, create a repurposing item
action: assign platform rewrite
action: wait for approval
action: schedule or notify publisher
The automation should not decide strategy.
It should move clear signals into the workflow.
Humans still decide:
whether the post should be reused
how the angle should change
whether claims need verification
which landing page should be linked
whether the timing is right
Automation handles handoff.
Humans handle judgment.
What metrics should create actions?
Different metrics should trigger different actions.
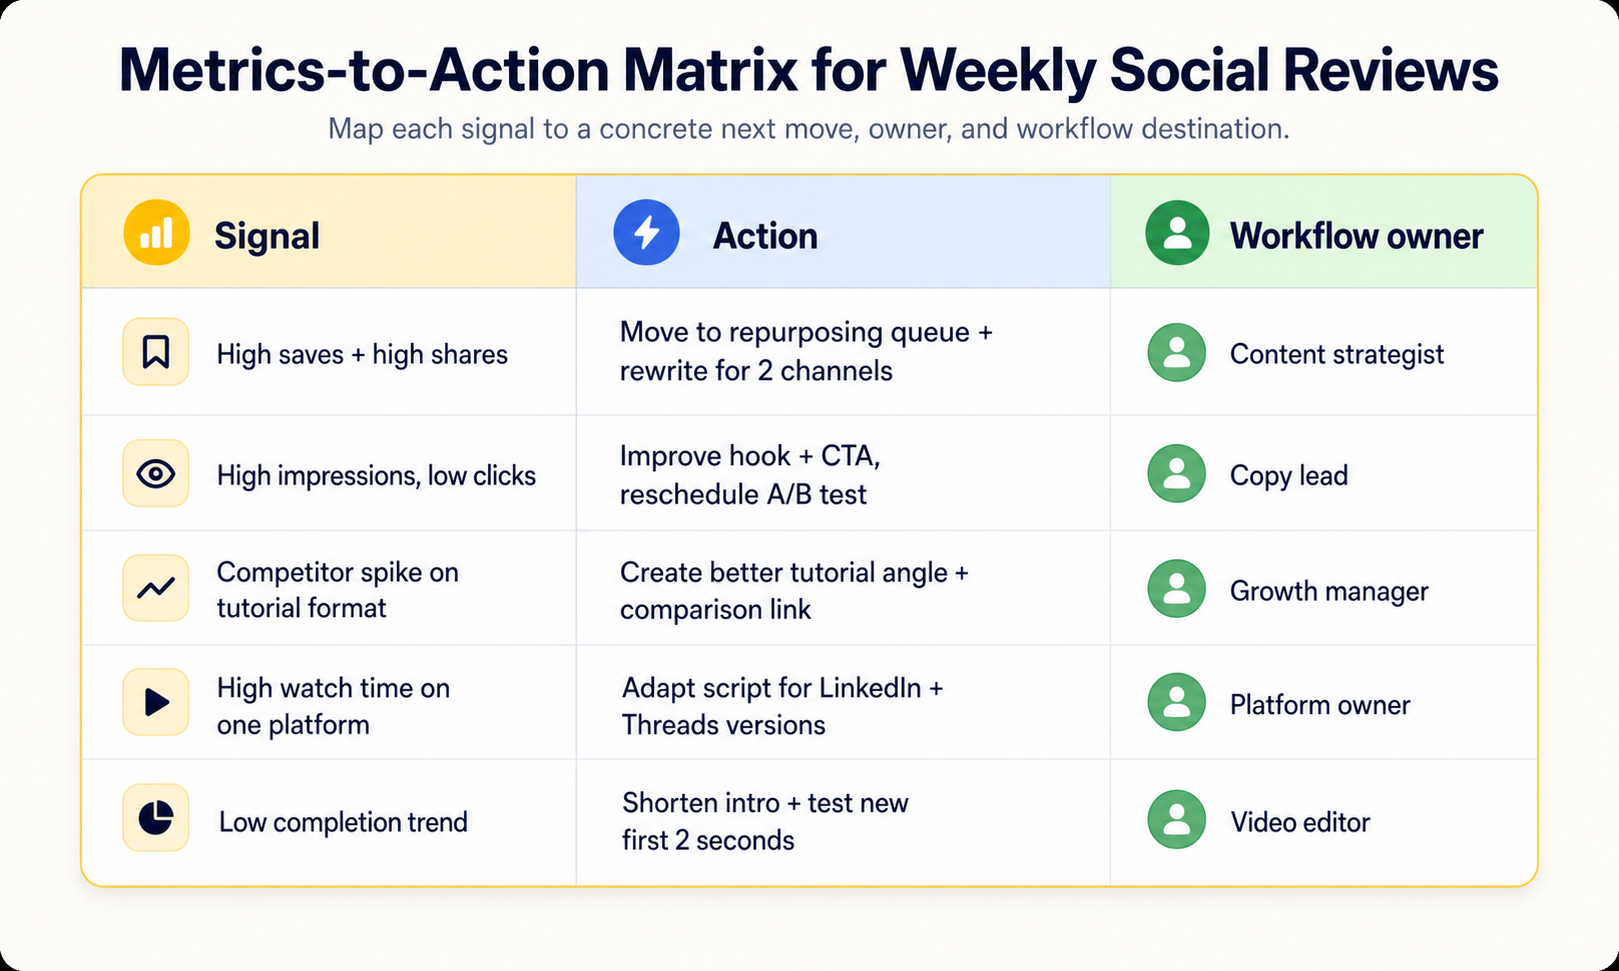
Metrics-to-action matrix for faster decisions during weekly reporting reviews.
Metric signalPossible actionHigh savesTurn into carousel, checklist, or evergreen postHigh sharesRepurpose into short video or Threads postHigh commentsCreate follow-up post from comment themesHigh clicksBuild landing page or link sequence around topicHigh watch timeReuse hook or script structureLow completion rateImprove hook or shorten introHigh impressions but low clicksImprove CTA or search intent matchCompetitor spikeAnalyze format and create differentiated responseHigh search impressionsAdd internal links or expand sectionStrong paid performanceTest organic versions or retargeting content
This makes reporting practical.
Every metric should have a possible response.
How Tareno fits into reporting-to-action workflows
Tareno is designed for teams that want social media reporting connected to execution.
Relevant Tareno components include:
unified analytics
competitor analysis
repurposing queue
workflow builder
content boards
team workspaces
approval workflows
roles and permissions
activity visibility
AI captions and hashtags
API access
Make integration
n8n integration
This matters because reporting is not isolated.
Reporting should connect to:
what to create next
what to repurpose
what to approve
what to schedule
what to test
what to improve
what to link internally
what to automate
A pure reporting tool can show performance.
A workflow-first system can help the team act on performance.
Tool comparison context
Different tools solve different reporting problems.
NeedTool type that often fitsAnalytics and competitor reportsMetricool-style analytics toolInbox, moderation, ROI reportsAgorapulse-style platformPremium care reportingSprout Social-style platformBroad social reports and listeningHootsuite-style suiteWorkflow reporting and repurposingTareno-style workflow system
If the main need is analytics dashboards, Metricool may be useful.
If the main need is inbox and moderation reporting, Agorapulse may be useful.
If the main need is enterprise care reporting, Sprout Social may be useful.
If the main need is turning analytics into repurposing, approvals, tasks, and automation, Tareno is the stronger fit.
Reporting-to-action checklist
Use this checklist after every reporting review.
Performance
Which posts beat the baseline?
Which posts underperformed?
Which platforms moved?
Which formats changed?
Which topics created meaningful actions?
Insight
Why did this happen?
Is this a content, platform, timing, format, or audience signal?
Is this signal strong enough to act on?
Action
Should this be repurposed?
Should this become a new post?
Should this become a blog?
Should this become a landing page update?
Should this become a comparison page?
Should this become an internal link?
Should this become a workflow change?
Ownership
Who owns the action?
When is it due?
Does it need approval?
Which board/stage should it move to?
Automation
Can Make or n8n help move this action?
Should a threshold trigger a repurposing task?
Should the action sync to another system?
Should the next report include status?
Related Tareno resources
Use analytics reports, workflow builder, and repurposing queue to operationalize these decisions. Connect that with social media repurposing workflow and social media workflow builder. For vendor context, review the Metricool alternative, Agorapulse alternative, and Sprout Social alternative.
FAQ
Why is social media reporting not enough?
Social media reporting is not enough because reports only show what happened. Teams need a workflow that turns insights into tasks, repurposing actions, approvals, content changes, and future strategy.
How do you turn social media analytics into action?
Turn analytics into action by identifying performance signals, classifying the insight, creating a task, assigning an owner, moving it into a workflow board, approving the work, publishing or repurposing, and measuring again.
What should a social media report include?
A useful social media report should include performance data, key insights, explanation of what changed, recommendations, next actions, owners, deadlines, and which content should be repurposed or improved.
What metrics matter most in social media reporting?
The best metrics depend on the goal. Saves, shares, comments, watch time, clicks, conversions, follower growth, impressions, and competitor movement can all matter if they lead to a decision.
How can reporting improve content repurposing?
Reporting identifies high-performing posts and patterns. Those posts can be moved into a repurposing queue and adapted for new platforms, formats, or audiences.
How can competitor analysis become a workflow?
Competitor analysis becomes a workflow when competitor signals are turned into content ideas, comparison pages, landing page updates, short-form scripts, internal links, or campaign tasks.
Can Make or n8n automate social media reporting workflows?
Yes. Make or n8n can help move reporting signals into tasks, notify owners, update trackers, create repurposing items, and connect analytics data to workflow systems. Human review should still guide strategy.
Which tool is best for reporting-to-action workflows?
Metricool, Agorapulse, Sprout Social, and Hootsuite are strong for different reporting use cases. Tareno is a strong fit when teams need reporting connected to repurposing, workflow automation, boards, approvals, roles, activity visibility, Make, n8n, and API workflows.
Final thoughts
Social media reporting is valuable.
But reporting should not be the finish line.
It should be the start of the next action.
The best teams do not only ask:
What happened?
They ask:
What should we do because of what happened?
That question changes everything.
It turns analytics into tasks.
It turns winning posts into repurposing workflows.
It turns competitor signals into content ideas.
It turns reports into strategy.
It turns strategy into execution.
If your team creates reports every month but the content process stays the same, the reporting workflow is incomplete.
The next step is not more charts.
The next step is a system that turns analytics into action.
Primary CTA: Explore Tareno features to see how analytics, competitor analysis, repurposing queues, boards, workflow builder, approvals, Make, n8n, API, roles, and activity visibility can work together.
Secondary CTA: Compare Tareno with Metricool, Sprout Social, Agorapulse, and Hootsuite on the compare hub.