

TL;DR
YouTube Studio charts answer different questions: discovery, clicks, watch behavior, and audience mix.
Impressions are not views, and CTR is not a verdict on video quality.
Audience retention is most useful when you connect the line to exact moments in the video.
The safest beginner workflow is to pair one signal with one likely cause and one next test.
If your reporting later spans several platforms, keep YouTube Studio for native interpretation and use a broader analytics layer for shared visibility.
YouTube Studio charts for beginners: what to check first
For beginners, YouTube Studio becomes easier when every chart maps to one decision. Start with impressions to understand discovery, CTR to evaluate packaging, audience retention to find weak moments, traffic sources to learn where viewers came from, and returning viewers to judge whether the channel is building repeat demand.
Impressions: YouTube showed the video somewhere, but the viewer has not clicked yet.
CTR: the title and thumbnail convinced a share of those people to open the video.
Audience retention: the video kept or lost attention after the click, especially in the first 30 seconds.
Traffic sources: search, browse, suggested, Shorts, external, and channel pages each imply a different next test.
Next action: change only one thing at a time so you can tell whether packaging, topic, structure, or distribution caused the shift.
Quick Definition
YouTube Studio is YouTube’s native analytics environment for understanding how people found your videos, whether they clicked, how long they watched, and what kind of audience your content served. The hard part for beginners is usually not getting access to charts. It is understanding which chart answers which question.
You can open one video and see impressions, click-through rate, views, watch time, audience retention, and audience segments within a few clicks. That looks comprehensive, but it also makes it easy to draw the wrong conclusion. A video can get plenty of impressions but a weak click-through rate. Another can get good clicks but disappointing watch time. A third can attract many new viewers without becoming a favorite among returning subscribers. Those charts are not contradicting each other. They are describing different stages of performance.
That is the beginner mindset that matters most: charts are signals, not grades.
The M.A.P.S. Framework
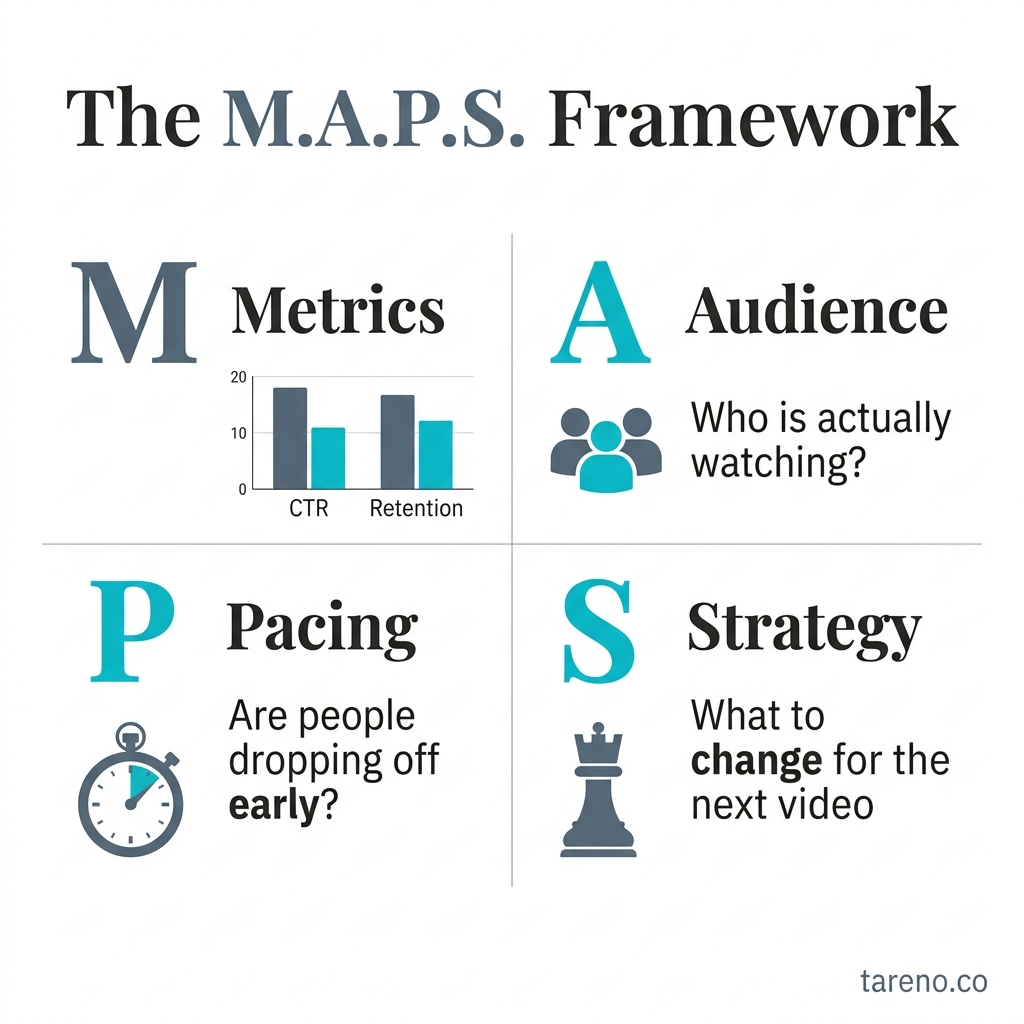
The MAPS Framework for reading YouTube Studio
To keep YouTube Studio useful instead of overwhelming, use the MAPS Framework:
M — Match the chart to the question
Ask what you want to know first. Was the video shown? Did viewers click? Did they stay? Did the right audience return?A — Avoid single-metric thinking
CTR without retention is incomplete. Views without traffic source are incomplete. Retention without video context is incomplete.P — Pair the signal with a likely cause
A weak CTR may suggest a packaging issue. Low impressions may suggest limited distribution, narrow demand, or a video that is still early.S — Select one next test
Make one meaningful change at a time so the next result is readable.
Mini-example
If a tutorial gets decent impressions but weak CTR, the first test usually belongs in the title, thumbnail, or framing. It does not mean the script failed. It means the packaging did not persuade enough viewers to start.
Start with the right question before you read any chart
Most dashboard confusion starts before the chart, not inside it. Beginners often click whatever graph looks dramatic instead of deciding what question they are trying to answer.
Use this shortcut:
If the question is "Was my video shown enough?", start with impressions.
If the question is "Why didn’t more people click?", start with CTR.
If the question is "Why didn’t viewers stay?", start with watch time and retention.
If the question is "Where are viewers coming from?", start with traffic sources.
If the question is "Who did this video really serve?", start with audience segments.
Mini-example
If your real concern is low clicks, audience retention is the wrong first chart. You need to inspect discovery and packaging before you diagnose what happened after the click.
The YouTube Viewer Funnel
What the Reach charts mean: impressions, CTR, views, and traffic sources
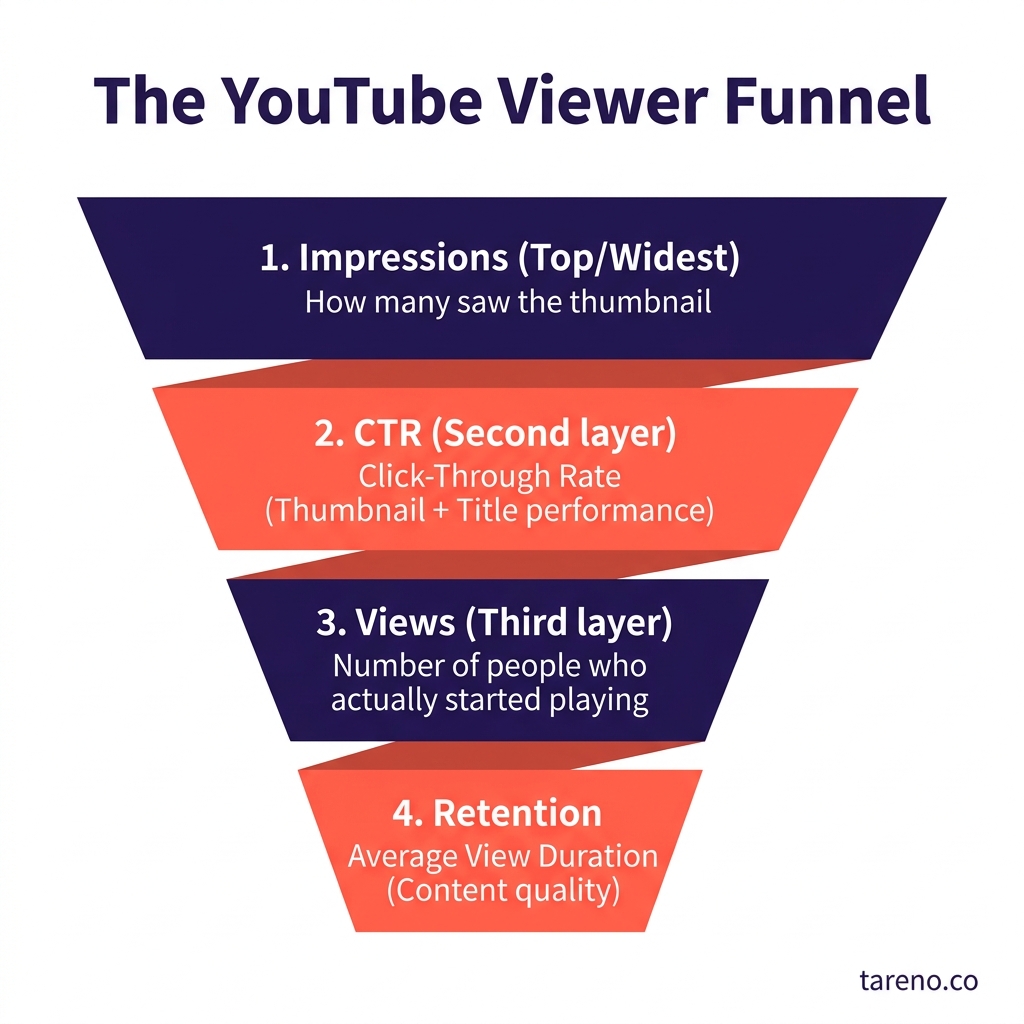
YouTube’s own help documentation describes the Reach side of analytics as the place to understand how viewers found your content. For beginners, the easiest way to read it is as a chain rather than a set of unrelated numbers.
Impressions
Impressions answer a simple question: How often was my thumbnail shown in qualifying YouTube surfaces?
According to YouTube, impressions count when a thumbnail is shown for more than one second and at least 50% of it is visible. YouTube also notes that impressions are not counted everywhere. External websites, embeds, cards, end screens, emails, and notifications are excluded.
What that means in practice:
Low impressions do not automatically mean the thumbnail is weak.
Low impressions can reflect narrow topic demand, limited early distribution, or a video that is still too early to judge.
High impressions do not guarantee success. They only tell you YouTube showed the packaging more often.
CTR
Impressions click-through rate answers: When people saw the thumbnail, how often did they choose to watch?
This is a packaging signal. It is often shaped by the fit between topic, title, thumbnail, and viewer expectation. But it is not the whole story. A strong CTR can still produce weak results if the video does not satisfy viewers after the click. A modest CTR can still support a useful video if the audience that clicks stays for a long time.
Views
Views answer: How many legitimate plays did YouTube count?
Views matter, but they can be misleading when read alone. A raw view total tells you volume, not the quality of discovery or the depth of viewing. That is why views are strongest when read next to traffic source and watch behavior.
Traffic sources
Traffic source reports answer: How did viewers find this video?
Search, browse, suggested videos, playlists, and external sources all describe different discovery paths. A video that lives mostly on search often behaves differently from one carried by suggested recommendations.
Mini-example
Suppose a video has low impressions, decent CTR, and most of its traffic comes from search. That can mean the people who do see it find it relevant, but the total distribution volume is limited. In that situation, improving the intro may not be the first fix. Refining the topic framing or search fit may matter more.
What the Engagement charts mean: watch time, average view duration, and retention
Once viewers click, the next job is to understand whether the video held attention.
Watch time
Watch time answers: How much time did viewers spend with this video or channel?
For beginners, this is often more informative than raw views because it helps reveal whether the content delivered enough value to keep people around.
Average view duration
Average view duration answers: On average, how long did viewers stay?
This metric becomes more useful when you compare similar videos rather than completely different formats. A short update and a long tutorial invite different viewing behavior, so direct comparisons can be misleading.
Audience retention
YouTube describes audience retention as a report that explains how well different moments of your video held viewers’ attention. That makes retention one of the most practical charts in the whole dashboard. It does not just tell you that people left. It points toward where they lost interest or where they replayed something.
YouTube also explains that the intro metric reflects the percentage of viewers still watching after the first 30 seconds. That matters because weak openings are one of the easiest beginner problems to diagnose and improve.
How to read common retention shapes
Early drop: the intro may be too slow, too vague, or mismatched with the promise of the title and thumbnail.
Gradual decline: often normal, especially in longer videos.
Sharp dip: one segment likely lost attention. Inspect what changed at that moment.
Spike: viewers replayed or revisited a moment. That can mean high value, or it can mean confusion.
Mini-example
A tutorial video spikes during one settings demonstration. That may be a strong moment viewers found useful. It may also mean they had to rewind because the step was hard to follow. The chart gives you the clue. The video itself gives you the explanation.
New vs. Returning Viewers
What the Audience charts mean: new vs returning viewers and who the video served
Audience charts help answer a question that beginners often ignore: Who was this video successful with?
YouTube documentation allows creators to review segments such as new versus returning viewers and subscribers versus non-subscribers. This matters because one upload can play different roles.
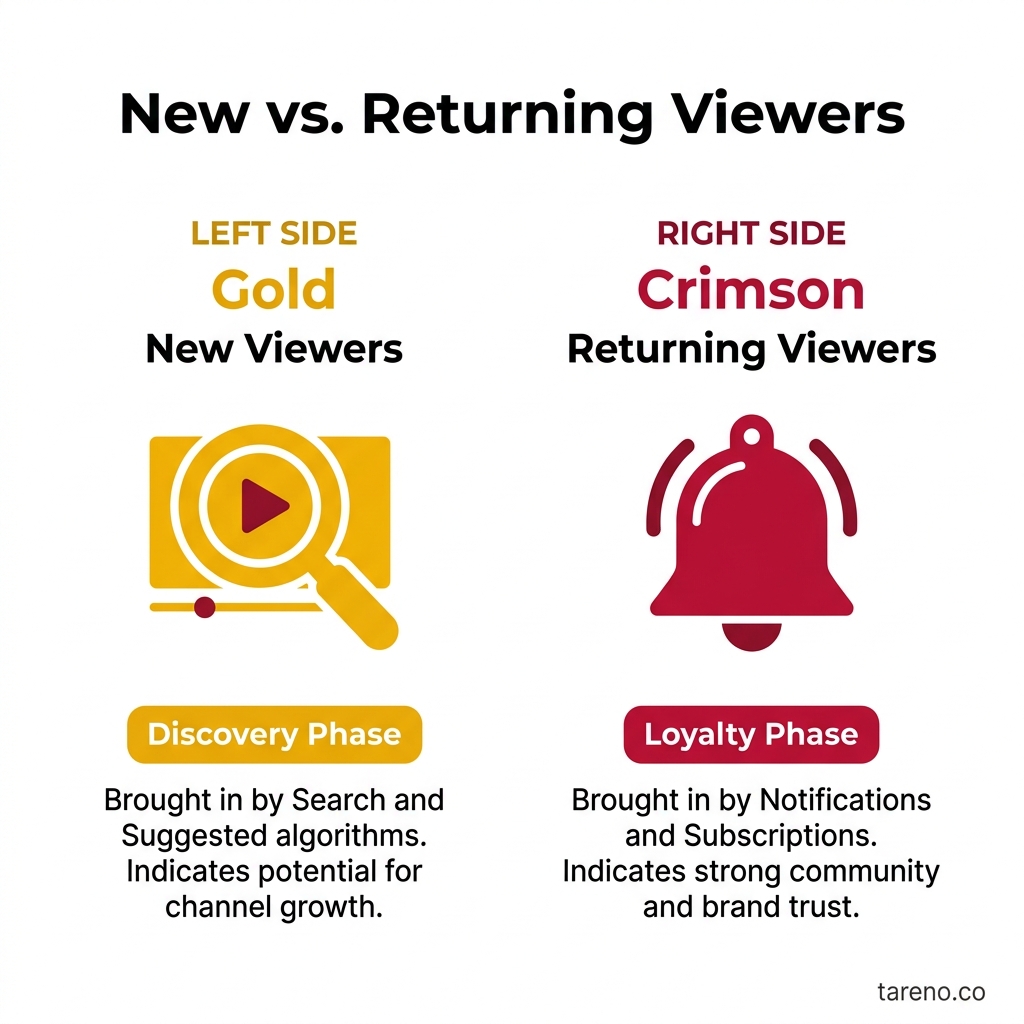
New viewers
New-viewer activity helps you see whether the video reached people who were not already regular viewers of the channel. This is especially useful for broad explainers, search-friendly tutorials, and first-touch content.
Returning viewers
Returning-viewer patterns show whether the video deepened an existing relationship with your audience. Series, regular formats, and loyalty-driven content often care more about this dimension.
Subscribers vs non-subscribers
This split helps clarify whether the video mainly served your current base or reached beyond it.
Mini-example
A beginner YouTube analytics guide may attract many first-time viewers and non-subscribers. That does not make it weak. It may simply mean the video worked as an acquisition asset rather than a loyalty asset.
The beginner workflow: how to turn a confusing chart into one useful action
A lot of creators misuse analytics because they respond emotionally to charts instead of turning them into a repeatable process. Use this workflow instead:
Observe the main signal
Pick the chart that matches your question.Add one supporting chart
If CTR looks weak, pair it with impressions. If retention looks weak, pair it with the exact moment in the video.Write one likely cause
Keep the explanation tentative. Use words like “may” and “could.”Choose one next test
Test a title, thumbnail, intro structure, pacing choice, or topic angle—not all at once.Wait for enough context
Let the test produce a readable result before changing the next variable.
Mini-example
If a tutorial has healthy search traffic but loses viewers in the first 30 seconds, the next move is usually to tighten the opening and clarify the benefit earlier. It is not automatically a keyword problem.
If your workflow later extends beyond one channel, it helps to separate interpretation from reporting. YouTube Studio remains the best place to interpret native charts like retention and traffic source detail. A broader platform becomes more useful after that, when a manager needs timeframe controls, top-content views, and a cross-channel review in one place.
When to trust the signal and when not to overreact
One of the best things in YouTube’s troubleshooting guidance is that it pushes creators away from superstition. Performance can change because of topic shifts, editing changes, thumbnail changes, upload cadence, seasonality, or broader changes in audience interest. That means not every drop should be treated like a platform penalty.
Good times to trust a signal
The chart matches what you can see in the video itself.
The pattern repeats across similar uploads.
Enough time has passed for the data to settle.
Supporting charts point in the same direction.
Times to be careful
The video is very new.
The sample size is still tiny.
You changed multiple variables at once.
The topic is seasonal or unusually trend-driven.
Mini-example
A drop during a back-to-school period may reflect changing audience behavior, not a broken channel. The chart still matters, but the cause may be bigger than the latest upload.
YouTube Studio vs spreadsheets vs a multi-platform analytics layer
Different setups serve different jobs.
OptionBest forMain limitationYouTube StudioNative chart definitions, retention analysis, traffic-source contextLess convenient for cross-channel reportingSpreadsheet trackingExperiment notes, manual observations, editorial review logsEasy to neglect and hard to scale consistentlyMulti-platform analytics layerShared visibility across YouTube and other social channelsShould not replace native YouTube definitions
For solo creators, YouTube Studio is often enough for native chart reading. But once a team needs YouTube reviewed alongside Instagram, TikTok, or Facebook in one reporting cycle, a broader analytics layer can save time.
Where a tool like Tareno fits without replacing YouTube Studio
Tareno’s internal feature documentation supports a narrow, practical use case here. It offers an analytics overview with core metrics such as audience, reach/impressions, and engagement. It also includes a YouTube dashboard within its platform-specific analytics suite, alongside timeframe controls and top-content views.
That does not mean it replaces YouTube Studio’s definitions. It means it can help when the operational problem is no longer “What does this retention dip mean?” but “How do we review YouTube next to our other channels in one reporting workflow?”
Mini-example
A creator can inspect retention and traffic source details inside YouTube Studio, then a social media manager can use Tareno to compare YouTube performance with other channels during a weekly review. That is a workflow advantage, not a claim that native YouTube analytics have become unnecessary.
If you are already building a content system around winning video topics, it also helps to turn YouTube videos into search-ready blog articles so your strongest ideas can live beyond the video itself.
Teams that want reporting and publishing processes to scale may also want to compare native workflows with automation tools before they add more moving parts.
And if your content mix includes shorts, it is useful to see how recommendation signals work on short-form platforms too, because distribution logic often changes by format.
When to use this guide and when not to
Use this guide when
you are new to YouTube Studio and need the main charts translated into plain English
you keep bouncing between metrics without knowing which one to trust first
you want decision rules rather than growth myths
you manage YouTube inside a wider social media workflow
Do not use this guide as
a benchmark sheet for “good” CTR or retention numbers across every channel and format
proof that one metric predicts growth on its own
a substitute for reviewing the actual video, title, thumbnail, and audience context
FAQ
What is the difference between impressions and views on YouTube?
Impressions refer to qualifying thumbnail exposures on certain YouTube surfaces. Views refer to legitimate plays that YouTube counts for the video. One measures exposure; the other measures actual watching.
Is low CTR always a thumbnail problem?
No. Thumbnails matter, but low CTR can also reflect weak topic positioning, unclear audience targeting, or a mismatch between where the video was shown and who wanted it.
What does a dip in audience retention mean?
Usually that viewers left, skipped, or lost interest around a specific moment. It can also reveal confusion or pacing problems. The chart tells you where to inspect, not the full reason by itself.
Which matters more for beginners: views or watch time?
Both matter, but watch time usually gives a better clue about whether the video held attention after the click. Views show volume; watch behavior shows satisfaction more directly.
Why do traffic sources matter before changing a video?
Because search, browse, suggested traffic, and external traffic behave differently. The same weak metric can call for different fixes depending on how viewers arrived.
When is it too early to judge YouTube Studio data?
When the video has very little data, when retention processing is still incomplete, or when you are reacting before a pattern forms. Early signals help, but they are easier to misread.
Can one video be good for new viewers but average for returning viewers?
Yes. Many broad beginner guides work mainly as acquisition content. That can still be a successful outcome if the goal was reach or audience growth.
Key Takeaways
Read YouTube Studio in sequence: discovery, click, watch behavior, then audience mix.
Impressions, CTR, views, and retention are connected, but they do not mean the same thing.
A chart becomes useful when you pair it with the exact moment, discovery path, or audience segment behind it.
Avoid single-metric reactions and run one clear test at a time.
Use YouTube Studio for native interpretation and a broader analytics layer only when the job becomes cross-channel reporting.
Sources
YouTube Help: Get started with YouTube Analytics — https://support.google.com/youtube/answer/1714323?hl=en
YouTube Help: Understand your YouTube video reach — https://support.google.com/youtube/answer/9314355?hl=en
YouTube Help: Check your YouTube impressions and watch time — https://support.google.com/youtube/answer/9314486?hl=en
YouTube Help: Measure key moments for audience retention — https://support.google.com/youtube/answer/9314415?hl=en
YouTube Help: Watchtime drop tips — https://support.google.com/youtube/answer/15086271?hl=en
Internal product reference: /root/.openclaw/workspace-blog/tareno_features.md