Most social media reports answer the wrong question.
They tell you what happened.
They do not tell you what to do next.
That is why many teams look at dashboards every week and still keep guessing what to post.
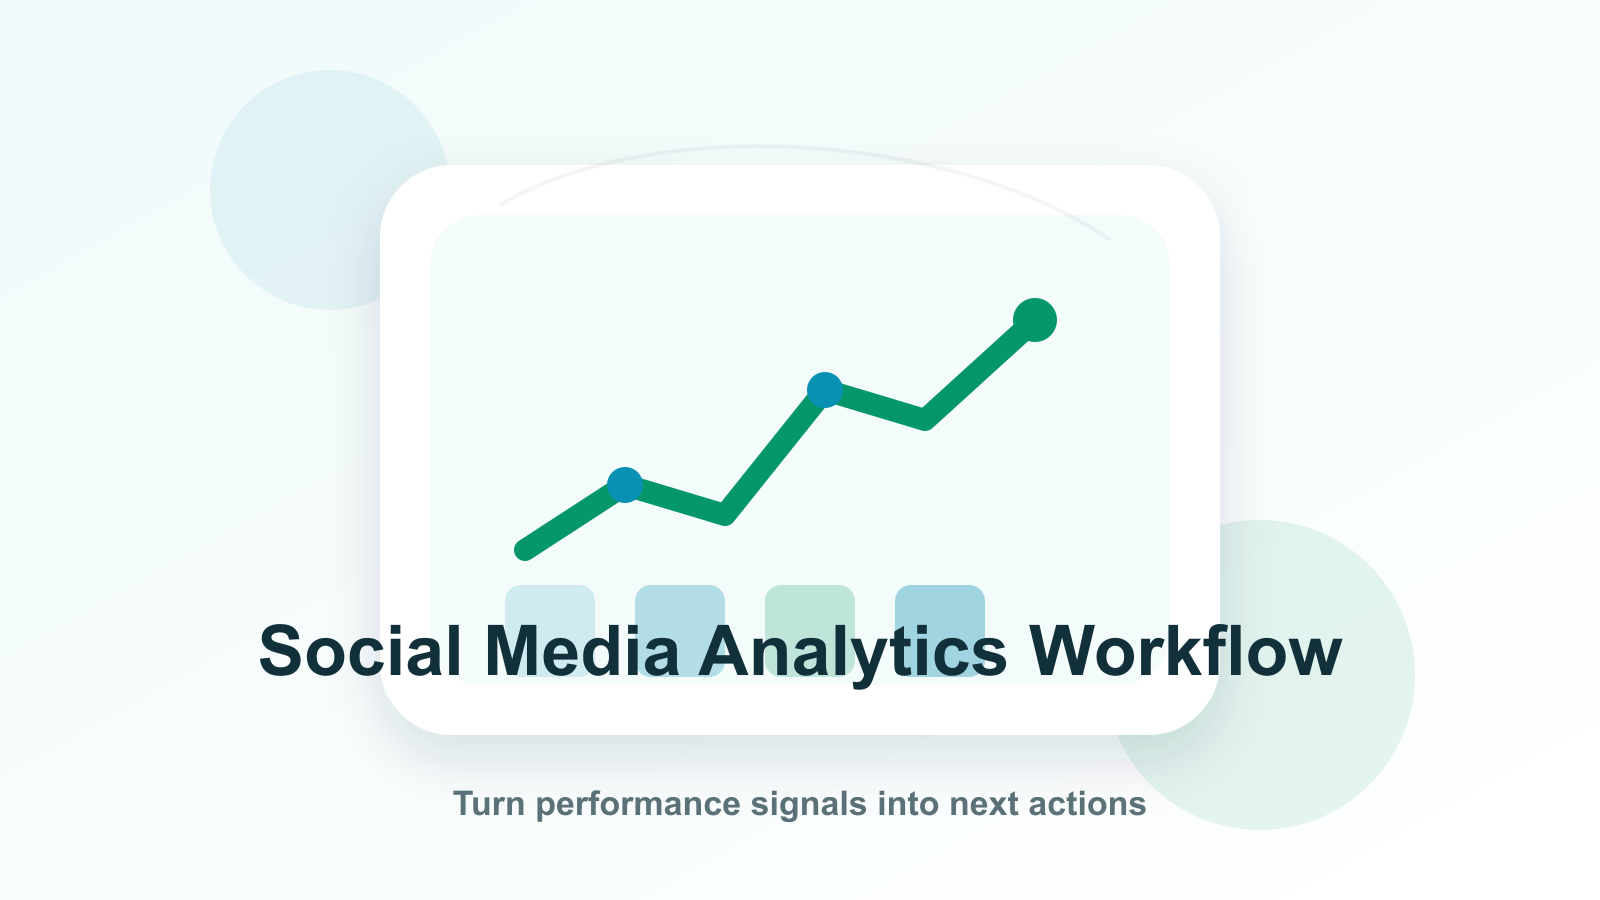
A social media analytics workflow turns metrics into decisions.
It helps creators, agencies, SaaS teams, and small teams decide what to repeat, what to stop, what to repurpose, what to test, what to approve, and what to turn into a deeper content asset.
The goal is not more reporting.
The goal is better execution.
A good analytics workflow connects performance data to the next content cycle.
This guide explains how to build a social media analytics workflow that turns metrics into content decisions, repurposing tasks, approvals, reports, and workflow automation.
TL;DR
A strong social media analytics workflow follows this loop:
Collect the right metrics.
Compare against a baseline.
Identify the performance signal.
Interpret why it happened.
Decide the next action.
Assign an owner.
Route the task into the workflow.
Repurpose, improve, or archive.
Measure again.
The key rule:
A metric is only useful if it creates a decision.
If a report does not change what you do next, it is documentation, not strategy.
Why social media analytics workflows fail
Analytics workflows usually fail for predictable reasons.
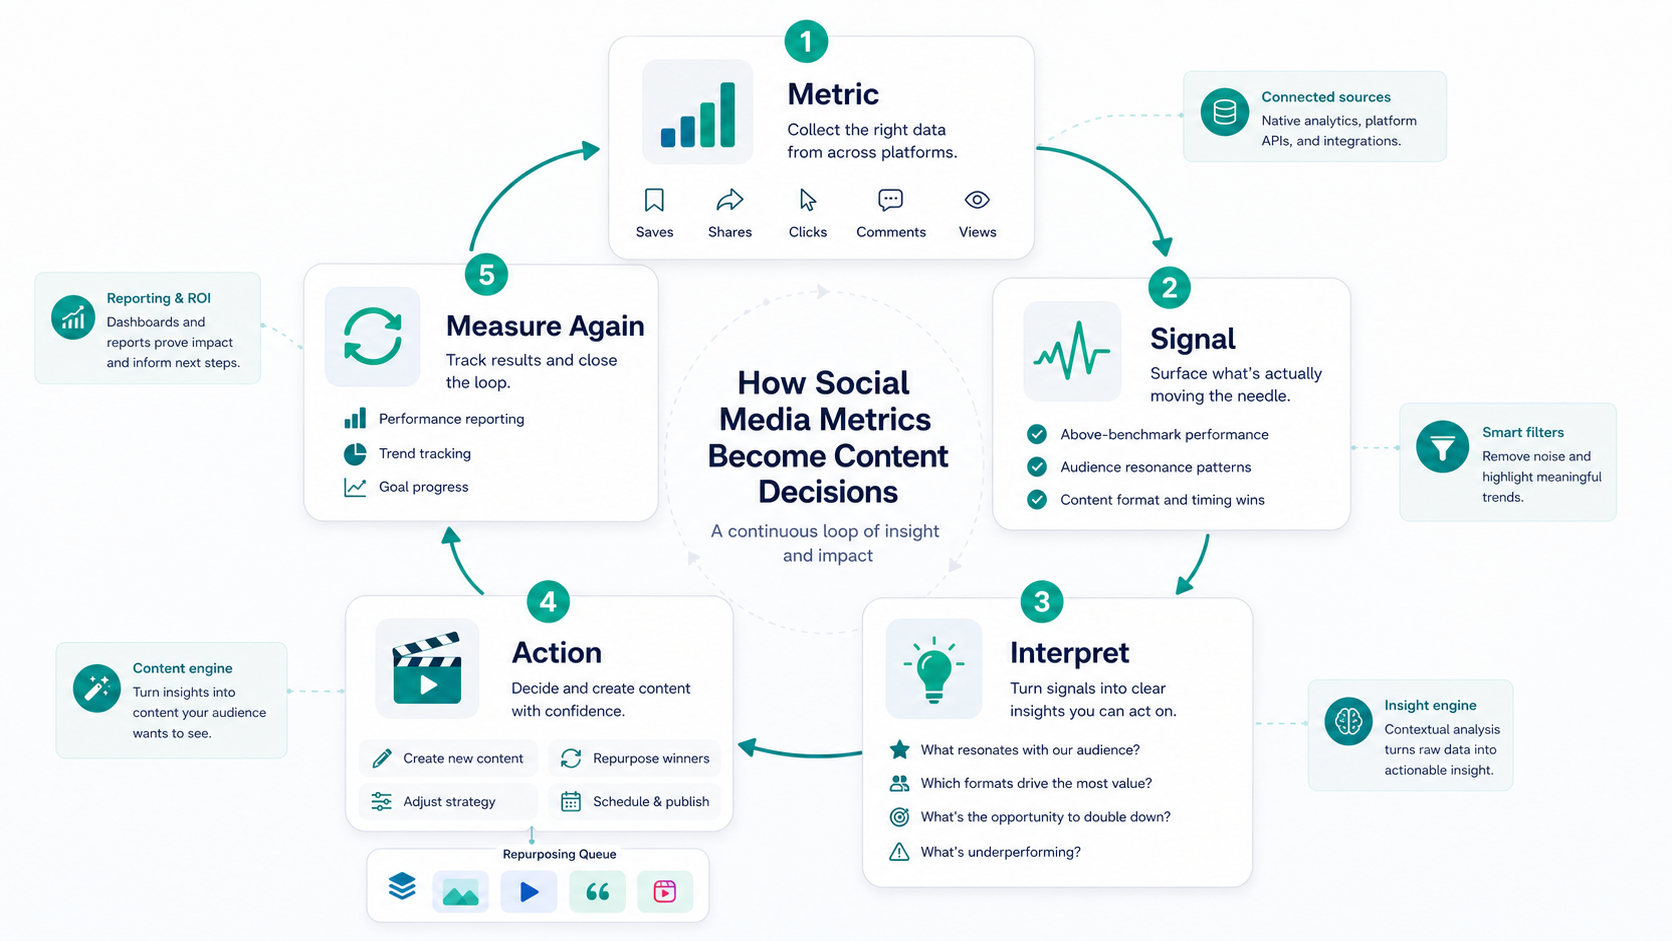
A strong analytics workflow turns metrics into signals, actions, and a second measurement loop.
The next visual adds the practical layer behind this point: visual map showing how social media signals become content decisions.
Visual map showing how social media signals become content decisions.
Teams track too many numbers
A report with 40 metrics can look impressive but create no action.
Metrics are not tied to goals
Reach may matter for awareness.
Clicks may matter for demand generation.
Saves may matter for educational content.
Replies may matter for community.
Each goal needs different interpretation.
There is no baseline
A post with 1,000 views may be strong for one account and weak for another.
Without baseline, teams cannot tell what is actually good.
Reports do not create tasks
A team may know what performed well but never repurpose it.
Analytics are disconnected from workflow
The dashboard says one post won, but there is no repurposing queue, owner, or next step.
Teams copy the wrong signal
A post may perform well because of topic, hook, format, timing, or controversy. If the team copies the wrong element, the next post may fail.
A better workflow solves these issues.
The DECIDE framework
Use the DECIDE framework to turn social media metrics into content decisions.
D — Define the goal
E — Establish baselines
C — Capture the signal
I — Interpret the reason
D — Decide the action
E — Execute and evaluate again
This keeps analytics practical.
D — Define the goal
Before reviewing metrics, define what success means.
Different goals need different metrics.
Awareness
Useful metrics:
reach
impressions
video views
follower growth
profile visits
Engagement
Useful metrics:
comments
replies
shares
saves
reactions
watch time
Traffic
Useful metrics:
link clicks
click-through rate
landing page visits
UTM performance
Conversion
Useful metrics:
signups
trials
demo requests
purchases
assisted conversions
Retention or education
Useful metrics:
saves
completion rate
repeat views
comments with questions
support deflection topics
The metric depends on the job of the content.
Do not judge every post by the same number.
E — Establish baselines
A baseline tells you what normal looks like.
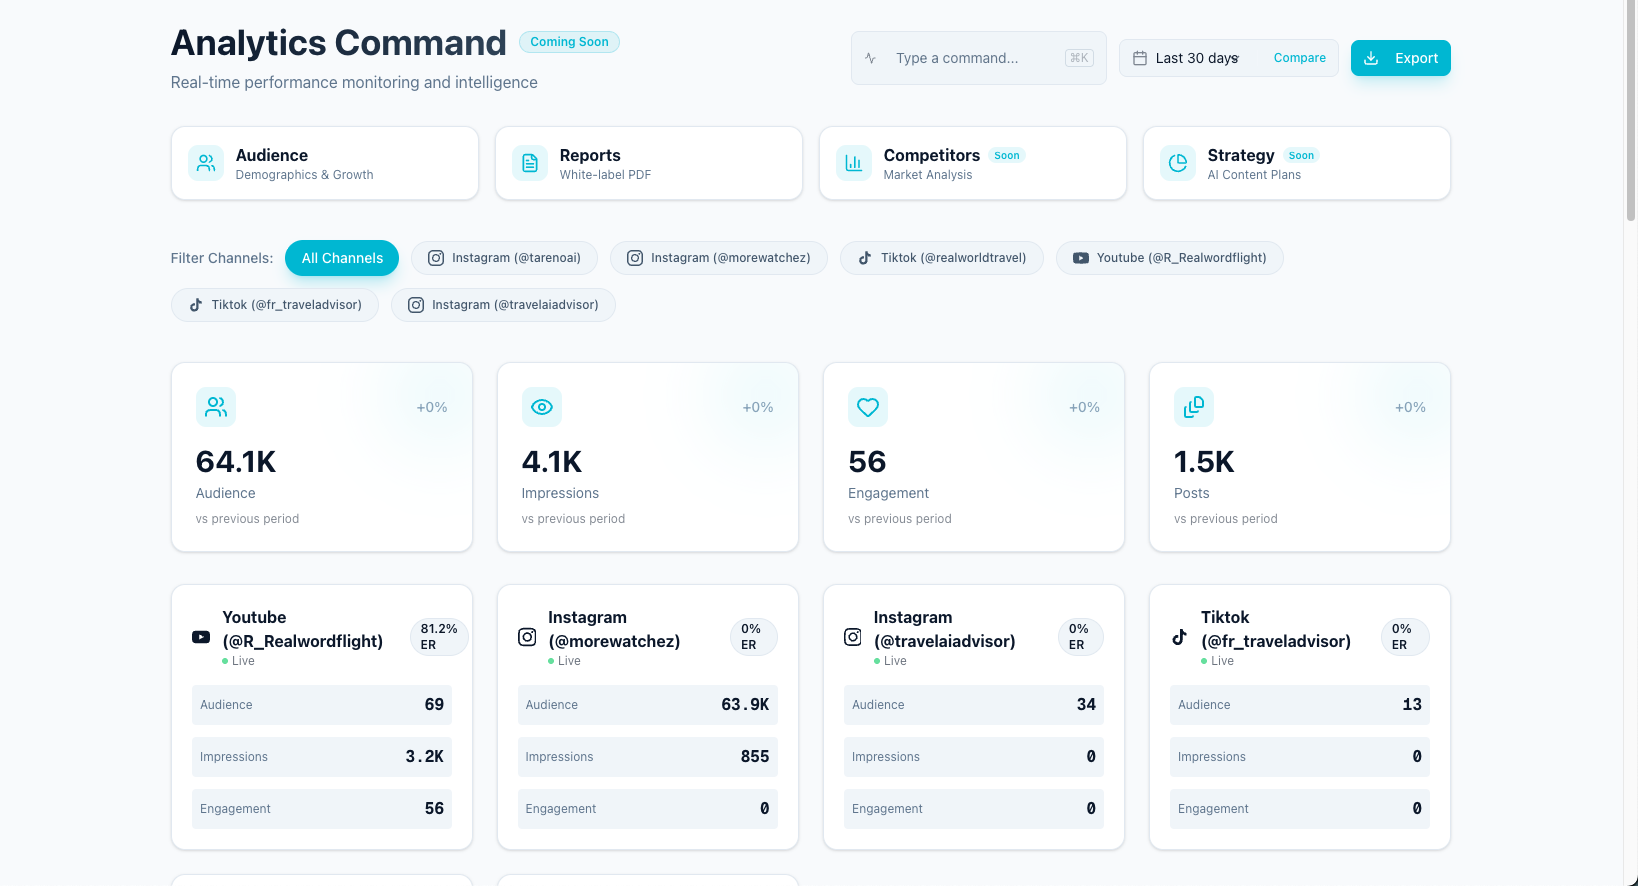
Baselines make weekly fluctuations interpretable instead of noisy.
Without a baseline, performance is hard to judge.
Track baselines by:
platform
post format
topic
campaign
account size
time period
Example baselines:
average Reel views over last 30 days
average LinkedIn clicks per post
average Pinterest outbound clicks per pin
average Threads replies per topic
average Instagram carousel saves
average TikTok watch time
Then compare posts against relevant baselines.
A post is not good because the number is big.
A post is good because it beats the right baseline.
C — Capture the signal
A signal is a metric pattern that suggests a next action.
Examples:
High saves
Signal:
The content was useful enough to keep.
Possible action:
turn into carousel
create follow-up checklist
repurpose to Pinterest
add to evergreen queue
High shares
Signal:
The content resonated with identity, opinion, or usefulness.
Possible action:
create series
test similar hook
repurpose to Threads or LinkedIn
High clicks
Signal:
The audience showed intent.
Possible action:
create deeper blog
improve landing page
add internal links
build comparison page
High comments
Signal:
The audience has questions, objections, or emotional response.
Possible action:
create FAQ content
create reply video
build follow-up thread
update product messaging
High watch time
Signal:
The hook and pacing worked.
Possible action:
reuse video structure
create similar short-form post
test another topic with same format
The signal is the bridge between number and decision.
I — Interpret the reason
Do not copy the metric blindly.
Ask why the post worked.
Was it:
topic?
hook?
format?
timing?
visual?
controversy?
audience pain point?
CTA?
platform trend?
specificity?
storytelling?
search intent?
social proof?
Example:
A post about “best time to post” may perform well because the audience wants shortcuts.
A better follow-up may not be another time-to-post article.
It may be:
Best time to post does not matter if your approval workflow delays content.
That is a sharper interpretation.
D — Decide the action
Every analytics review should create decisions.
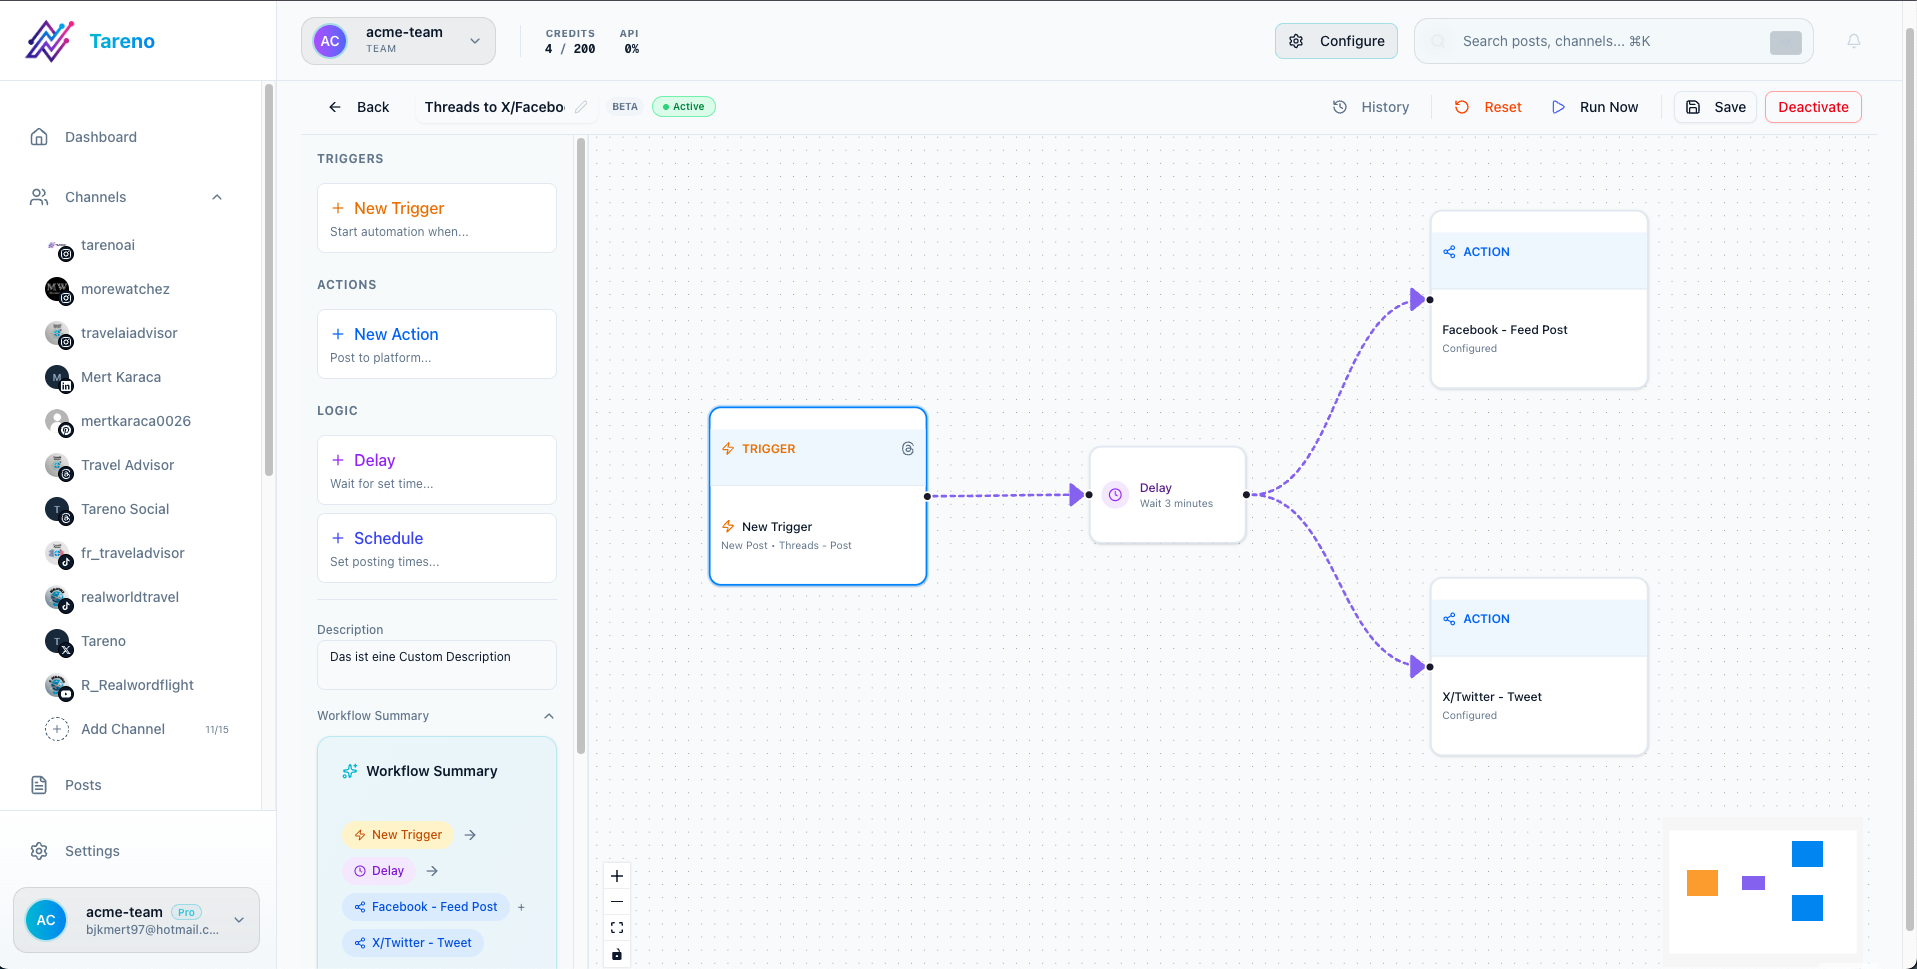
A decision is useful only when it is translated into a clear next action.
Decision categories:
Repeat
Use the same format or hook again.
Repurpose
Turn the post into another platform version.
Expand
Turn the topic into a blog, guide, page, email, or video.
Improve
Update the angle, caption, format, or CTA.
Pause
Stop doing formats or topics that consistently underperform.
Test
Create a controlled variation.
Archive
Do nothing if the post has no useful signal.
The workflow should force a decision.
Otherwise, analytics stay passive.
E — Execute and evaluate again
The decision should become a task.
A task should include:
owner
source post
metric signal
action type
target platform
due date
approval need
success metric
Example:
Source: Instagram carousel
Signal: 2.4x average saves
Action: Repurpose to Pinterest and LinkedIn
Owner: Content Lead
Approval: Brand review
Due: Friday
Success metric: saves/clicks
Then measure the second version.
This creates a learning loop.
Analytics workflow for creators
Creators should keep analytics simple.
Weekly workflow:
Review top 5 posts.
Identify why each performed.
Pick 1 to 3 posts to repurpose.
Rewrite for another platform.
Schedule.
Measure again.
Creators should focus on signals they can act on:
saves
shares
replies
watch time
clicks
follower growth
profile visits
The goal is not to become a data analyst.
The goal is to know what to repeat.
Analytics workflow for agencies
Agencies need analytics that create client value.
Monthly workflow:
Pull client report.
Identify top posts and weak formats.
Explain why performance changed.
Recommend next actions.
Assign tasks for next month.
Add winners to repurposing queue.
Present the report with decisions, not just charts.
A better client report says:
This carousel had 2x more saves than average, so we will turn the topic into a short-form video, a LinkedIn post, and a Pinterest pin.
That is more useful than:
Carousel got 400 saves.
Analytics workflow for SaaS teams
SaaS teams should connect analytics to business outcomes.
Useful workflow:
Review social posts by topic.
Identify clicks, replies, and conversion-adjacent signals.
Map high-performing topics to product pages, blog posts, or comparison pages.
Repurpose top posts into deeper assets.
Use social comments to improve FAQs.
Add internal links from new content.
Track whether social themes influence signups or trials.
For SaaS, social media analytics can feed:
SEO
GEO
product marketing
landing pages
sales objections
onboarding content
competitor positioning
Analytics workflow for small teams
Small teams need clarity and ownership.
Weekly workflow:
Analytics owner pulls top and bottom posts.
Team identifies 3 decisions.
Owners are assigned.
Approved actions move into content board.
Repurposing tasks are scheduled.
Results are reviewed next week.
Small teams should avoid reports that create no work.
The best output of an analytics meeting is a short action list.
What to automate in analytics workflows
Automation can help with handoffs.
Useful automations:
published post → create measurement task
wait 7 days → notify analytics owner
high-performing post → add to repurposing queue
report completed → create next-month tasks
post with high clicks → create landing page improvement task
competitor topic spike → create content idea
low-performing campaign → flag for review
approved recommendation → move into content calendar
Make, n8n, and API workflows are useful when analytics need to connect to trackers, dashboards, project management tools, and reports.
How Tareno fits into analytics workflows
Tareno is useful when analytics need to become workflow actions.
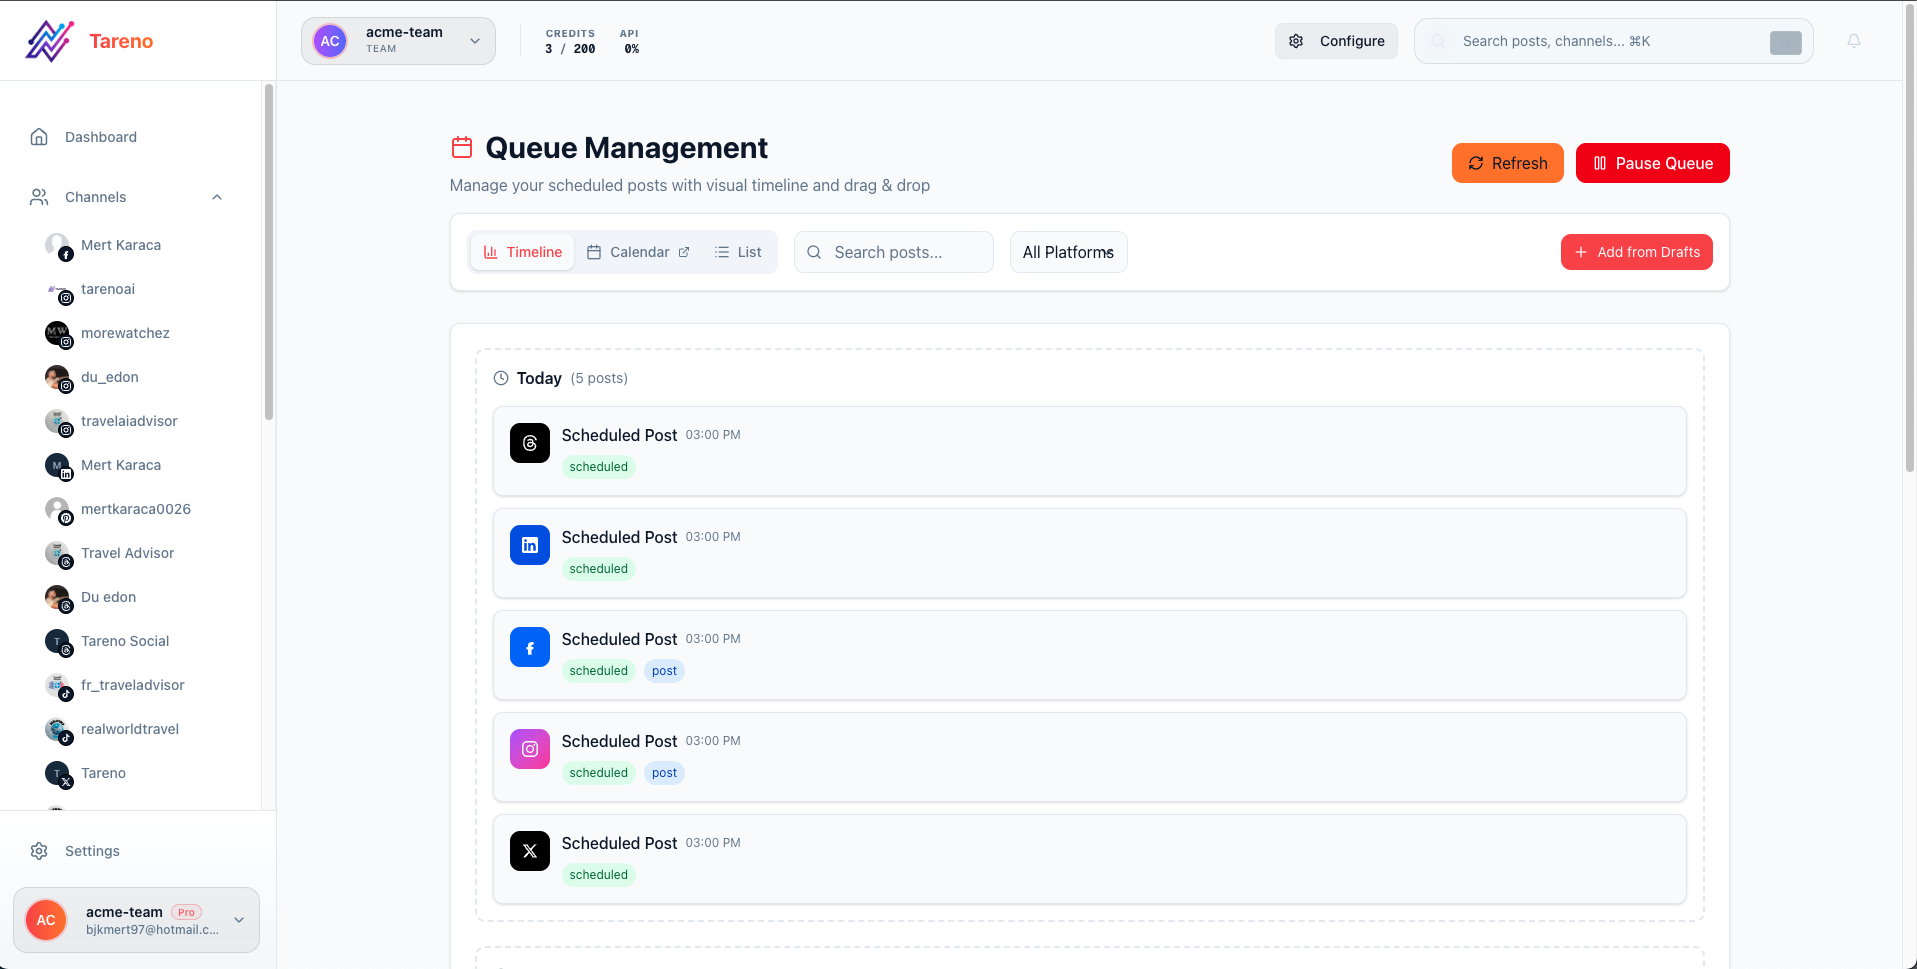
High-performing posts should feed a repurposing queue, not die in a report.
Relevant Tareno components include:
unified analytics
competitor analysis
content boards
repurposing queue
approval workflows
workflow builder
team workspaces
roles and permissions
activity visibility
AI captions and hashtags
Make integration
n8n integration
API access
This matters because analytics should not sit alone.
Tareno helps teams move from:
metric → insight → task → approval → publish → measure again
That is the difference between reporting and analytics-driven content operations.
Tool context
Different tools support different analytics workflows.
NeedTool type that often fitsReporting and dashboardsMetricool-style toolInbox and ROI reportingAgorapulse-style toolSocial care analyticsSprout Social-style toolBroad suite analyticsHootsuite-style toolSimple post analyticsBuffer-style schedulerAnalytics-to-action workflowsTareno-style system
If your main need is reporting, a reporting-first tool can work.
If your main need is turning metrics into content operations, a workflow-first tool is stronger.
Metrics-to-action cheat sheet
Metric signalWhat it may meanNext actionHigh savesUseful contentRepurpose to carousel, Pinterest, or checklistHigh sharesIdentity or strong opinionCreate series or Threads/LinkedIn versionHigh clicksIntentBuild deeper page or improve CTAHigh commentsQuestions or objectionsCreate FAQ, reply post, or explainerHigh watch timeHook/format worksReuse structure with new topicHigh reach, low engagementBroad but weak relevanceImprove specificityLow reach, high savesGood content, weak distributionRepurpose to search or emailHigh profile visitsInterest in creator/brandImprove bio/link pathHigh competitor engagementMarket interestCreate differentiated angle
Common mistakes
Mistake 1: Reporting everything
Too many metrics hide the useful signal.
Mistake 2: No baseline
You need to know what normal looks like.
Mistake 3: Optimizing for vanity metrics
Reach is useful, but not always the goal.
Mistake 4: No action owner
Every decision needs an owner.
Mistake 5: No repurposing queue
Top posts should not disappear.
Mistake 6: Copying competitors blindly
Use competitor signals to understand intent, not to copy.
Mistake 7: No second measurement
Repurposed content should be measured again.
Related Tareno resources
Use Tareno Features, Tareno Pricing and Compare Hub to place this recommendation in the broader Tareno stack. For vendor context, compare it with Metricool Alternative, Agorapulse Alternative, Sprout Social Alternative, Hootsuite Alternative and Buffer Alternative.
FAQ
What is a social media analytics workflow?
A social media analytics workflow is a repeatable process for collecting metrics, identifying signals, interpreting results, creating decisions, assigning tasks, and measuring again.
How do you turn social media metrics into decisions?
Define the goal, compare results against a baseline, identify the signal, interpret why it happened, choose an action, assign an owner, and route it into the content workflow.
What metrics should social media teams track?
Track metrics based on goals. Awareness may use reach and impressions. Engagement may use saves, shares, and comments. Traffic may use clicks. Conversion may use signups or assisted conversion data.
What should happen after a post performs well?
The post should be analyzed, added to a repurposing queue if relevant, rewritten for another platform, approved, scheduled, and measured again.
Can social media analytics be automated?
Yes. Teams can automate measurement reminders, reporting rows, high-performing post detection, repurposing tasks, and Make/n8n/API workflows.
Which tool is best for analytics workflows?
Metricool, Agorapulse, Sprout Social, and Hootsuite are strong for reporting use cases. Tareno is strong when analytics need to become workflow actions such as repurposing, approvals, scheduling, and automation.
Final thoughts
Social media analytics should not end in a dashboard.
The best analytics workflow turns metrics into decisions.
It helps teams know what to repeat, what to repurpose, what to improve, what to stop, and what to test next.
A report can tell you what happened.
A workflow helps you do something about it.
Primary CTA: Explore Tareno features to see how analytics, competitor analysis, boards, repurposing queues, approvals, Make, n8n, API, roles, and activity visibility can turn metrics into content decisions.
Secondary CTA: Compare Tareno with Metricool, Agorapulse, Sprout Social, Hootsuite, and Buffer on the compare hub.